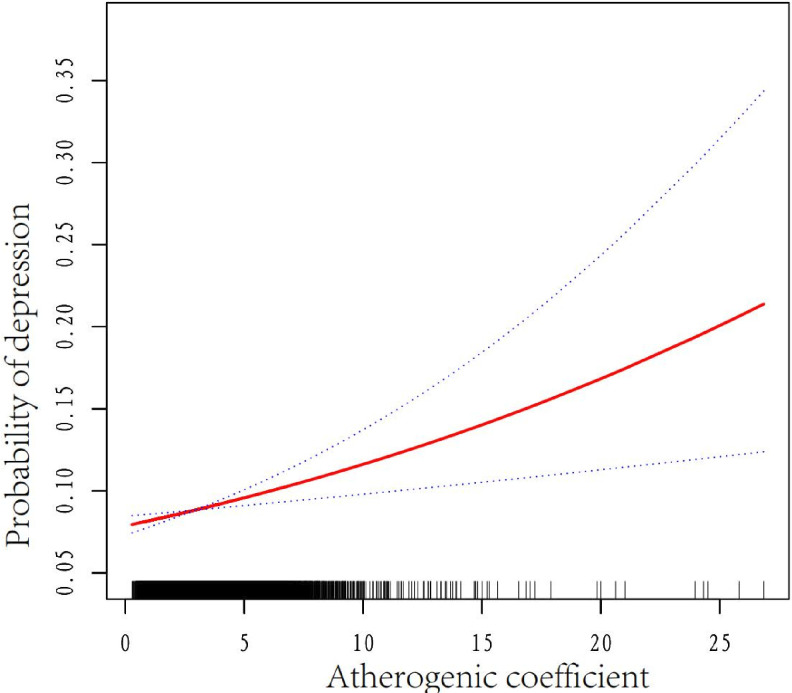
Figure 2.
Association between AC and depression in US adults (n=4759). The black vertical line on the horizontal axis represents the AC distribution, the red line represents the best fit and the difference between the dashed lines represents the 95% CI. The data were adjusted for age, sex, race/ethnicity, body mass index, poverty–income ratio, educational level, marital status, hypertension, diabetes mellitus, alcohol intake, smoking status, physical activity and glycosylated haemoglobin. AC, atherogenic coefficient.

