Figure 1.
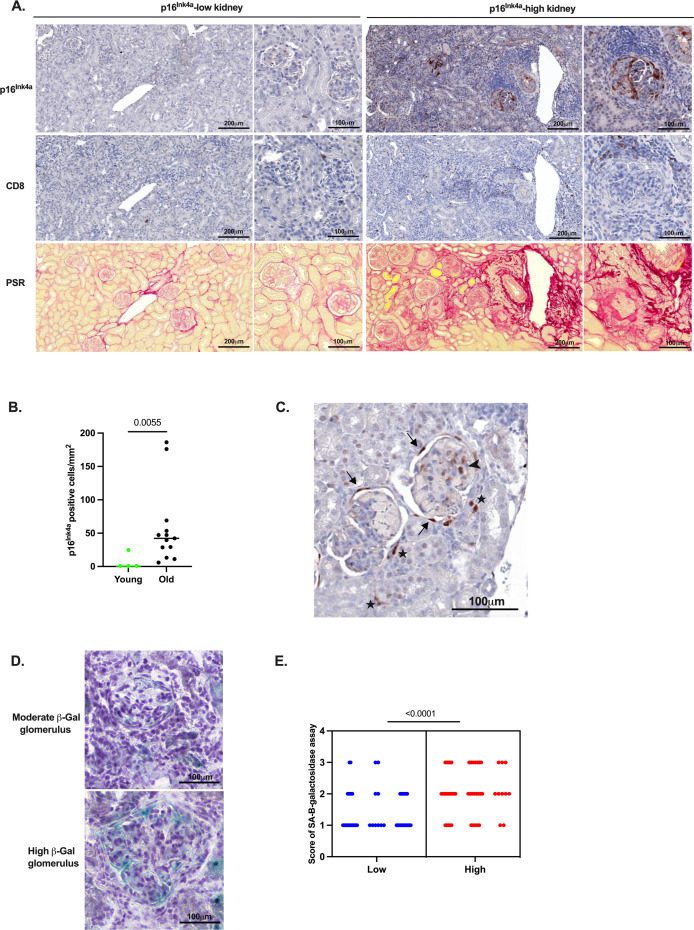
Markers of cellular senescence in kidneys from selected B6.Sle1.2.3 lupus-prone mice. (A) Anti-p16Ink4a (top row), anti-CD8 (middle row) and Picrosirius red (PSR, bottom row) staining of FFPE kidney serial sections, from 2 mice of 10-11 months of age. Overview (scale: 200 µm) and close-up (scale: 100 µm) of a p16Ink4a-low (≤50th percentile, left column) and a p16Ink4a-high (>50th percentile, right column) example. (B) Quantification of p16Ink4a (positive cells/mm2) in kidneys of 3 month-old mice (young; n=4) and 9–11 month-old mice (old; n=13). (C) Representative image from a kidney showing p16Ink4a-positive cells on Bowman’s capsules (arrow), within glomeruli (arrowhead) and cells from tubulointerstitium (filled star). (D) Representative images and (E) semiquantitative scores of glomerular SA β-gal staining of frozen OCT sections from low (≤50th percentile, n=3) versus high (>50th percentile, n=3) p16Ink4a-stained kidneys (10–20 glomeruli/mouse). Horizontal bars: medians. p values: Mann-Whitney test (p16Ink4a), nested t-test (β-gal assay). B6.Sle1.2.3, B6.NZMSle1/Sle2/Sle3; FFPE, formalin-fixed paraffin-embedded; OCT, optimal cutting temperature; SA β-gal, senescence-associated β-galactosidase.

