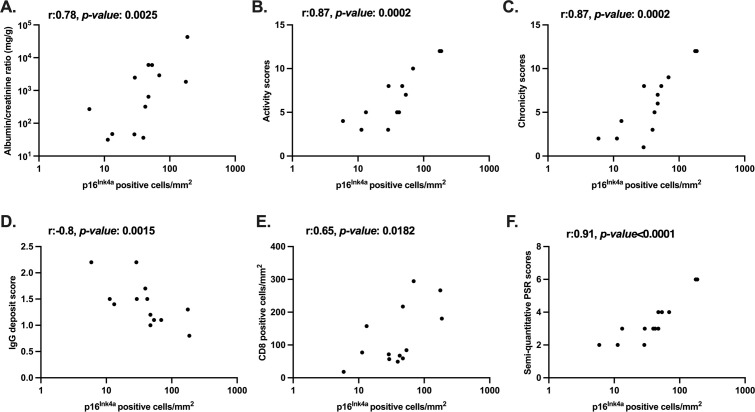
Figure 3.
Correlation between kidney p16Ink4a staining, renal disease parameters and kidney CD8+ T cell infiltration and fibrosis in aged B6.Sle1.2.3 mice. Correlation between p16Ink4a staining (positive cells/mm2) on FFPE kidney sections of 13 B6.Sle1.2.3 mice of 9–11 months of age, and (A) urine albumin/creatinine ratio (mg/g), (B,C) activity and chronicity scores (median from three blinded scorers, total scale: 0–12), (D) glomerular IgG deposit score (mean scores from three blinded scorers, 30 glomeruli/mouse), (E) CD8+ T cell kidney infiltration (positive cells/mm2) and (F) renal fibrosis (semi-quantitative PSR staining scores, scale from 0 to 6). r and p values: Spearman’s rank-order correlation coefficient. B6.Sle1.2.3, B6.NZMSle1/Sle2/Sle3; FFPE, formalin-fixed paraffin-embedded; PSR, Picrosirius red.

