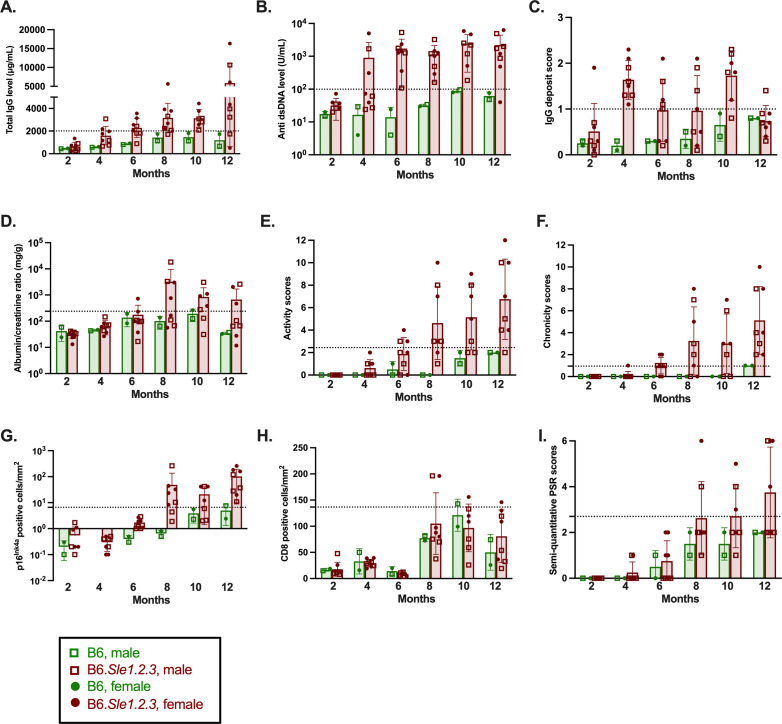
Figure 4.
Disease parameters, kidney p16Ink4a, CD8+ T cell infiltration and fibrosis over time. Two B6, 7 to 8 B6.Sle1.2.3 mice per time point. (A,B) Total IgG (μg/mL) and anti-dsDNA antibody (U/mL) in plasma. (C) Semi-quantitative evaluation of glomerular IgG deposits in frozen OCT kidney sections. (D) Urine albumin/creatinine ratio (mg/g). (E,F) Histopathological activity and chronicity scores on H&E-stained FFPE kidney sections (scale: 0–12). (G–I) Quantification of p16Ink4a (positive cells/mm2), quantification of anti-CD8 staining (positive cells/mm2), semi-quantitative PSR staining scores (scale: 0–6) on serial FFPE kidney sections. Bars: mean±SD. Green: B6; maroon: B6.Sle1.2.3. Circles: female; squares: male. Horizontal dotted lines: mean plus 2 SD of all 12 (2–12 month old) B6 mice. anti-dsDNA, anti-double-stranded DNA; B6.Sle1.2.3, B6.NZMSle1/Sle2/Sle3; FFPE, formalin-fixed paraffin-embedded; OCT, optimal cutting temperature; PSR, Picrosirius red.

