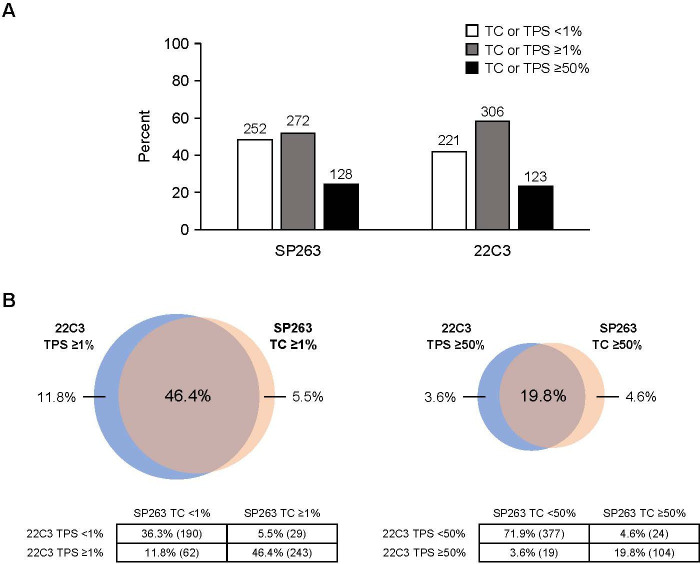
Figure 2.
(A) Prevalence of patients identified in the programmed death-ligand 1 (PD-L1)-negative, PD-L1-positive, and PD-L1-high subgroups among the patients with stage II–IIIA NSCLC in the combined-biomarker-evaluable population (BEP) according to the SP263 assay or among the 22C3-BEP according to the 22C3 assay. (B) Venn diagrams show the percentage of patients in the stage II–IIIA combined-BEP that were defined as having tumors that were PD-L1 positive or PD-L1 high according to both, just one, or neither of the SP263 and 22C3 assays. TC, tumor cell; TPS, tumor proportion score.

