. 2023 Sep 5;4(11):850–864. doi: 10.1039/d3cb00114h

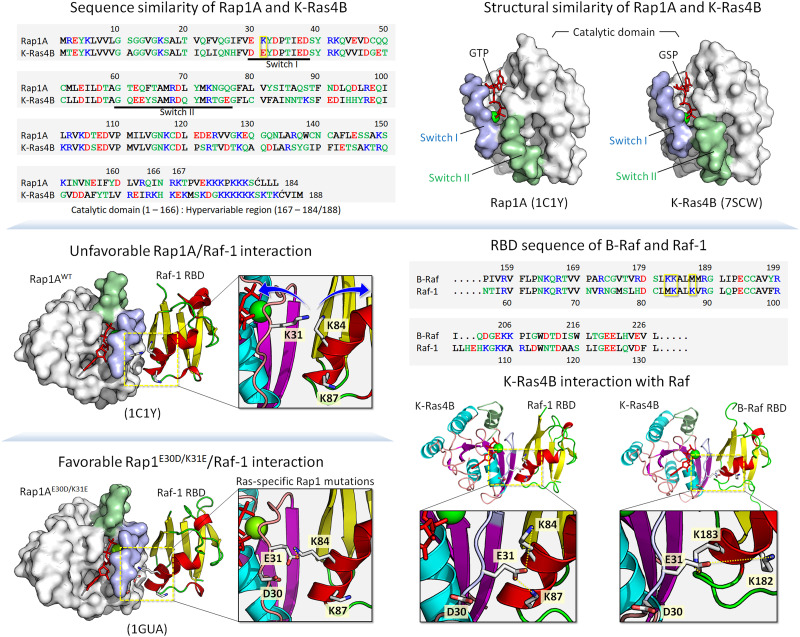
Fig. 1. Sequence alignment and side-by-side comparison of the catalytic domain structures of Rap1A and K-Ras4B showing similarity (top panels). In the sequence, hydrophobic, polar/glycine, positively charged, and negatively charged residues are colored black, green, blue, and red, respectively. The yellow box at position 31 in the sequence indicates a key residue involved in the Raf RBD interaction. The crystal structure of the Rap1A catalytic domain interacting with the Raf-1 RBD shows an unfavorable interaction due to electrostatic repulsion between Lys31 of Rap1A and Lys84 of the Raf-1 RBD (middle left panel). Ras-specific mutation E30D/K31E of Rap1A restores interaction with Raf-1 RBD (bottom left panel). RBD sequences of B-Raf and Raf-1 and highlighting key residues in the yellow boxes that are involved in the GTPase interaction (middle right panel). Small GTPases interact with Raf through their catalytic domains, forming a strong backbone β-sheet interface with the Raf RBD. In addition to the backbone interaction, a strong salt bridge interaction contributes to the stability of the complex, as shown by the model structures of K-Ras4B interacting with the Raf-1 and B-Raf RBDs (bottom right panels). The example shows that Glu31 of K-Ras4B can form salt bridges with Lys84 and Lys87 of the Raf-1 RBD and Lys182 and Lys183 of the B-Raf RBD.

Fig. 1