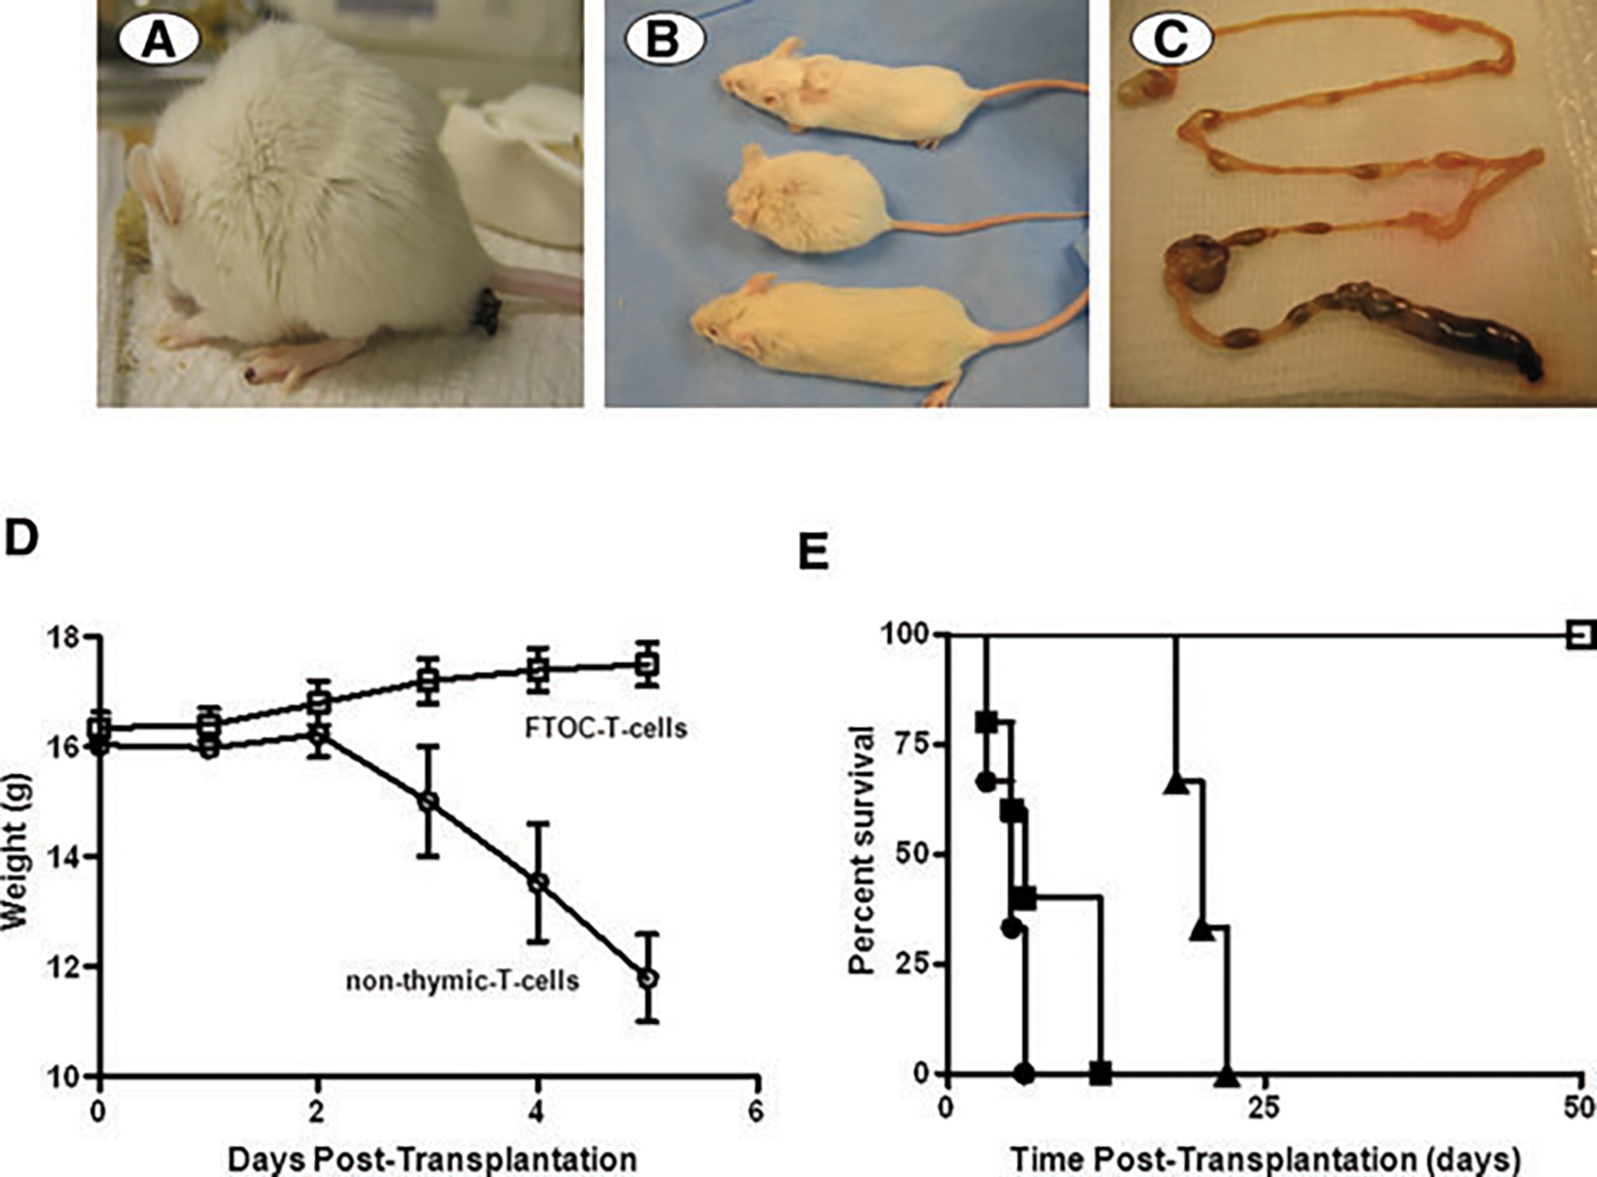
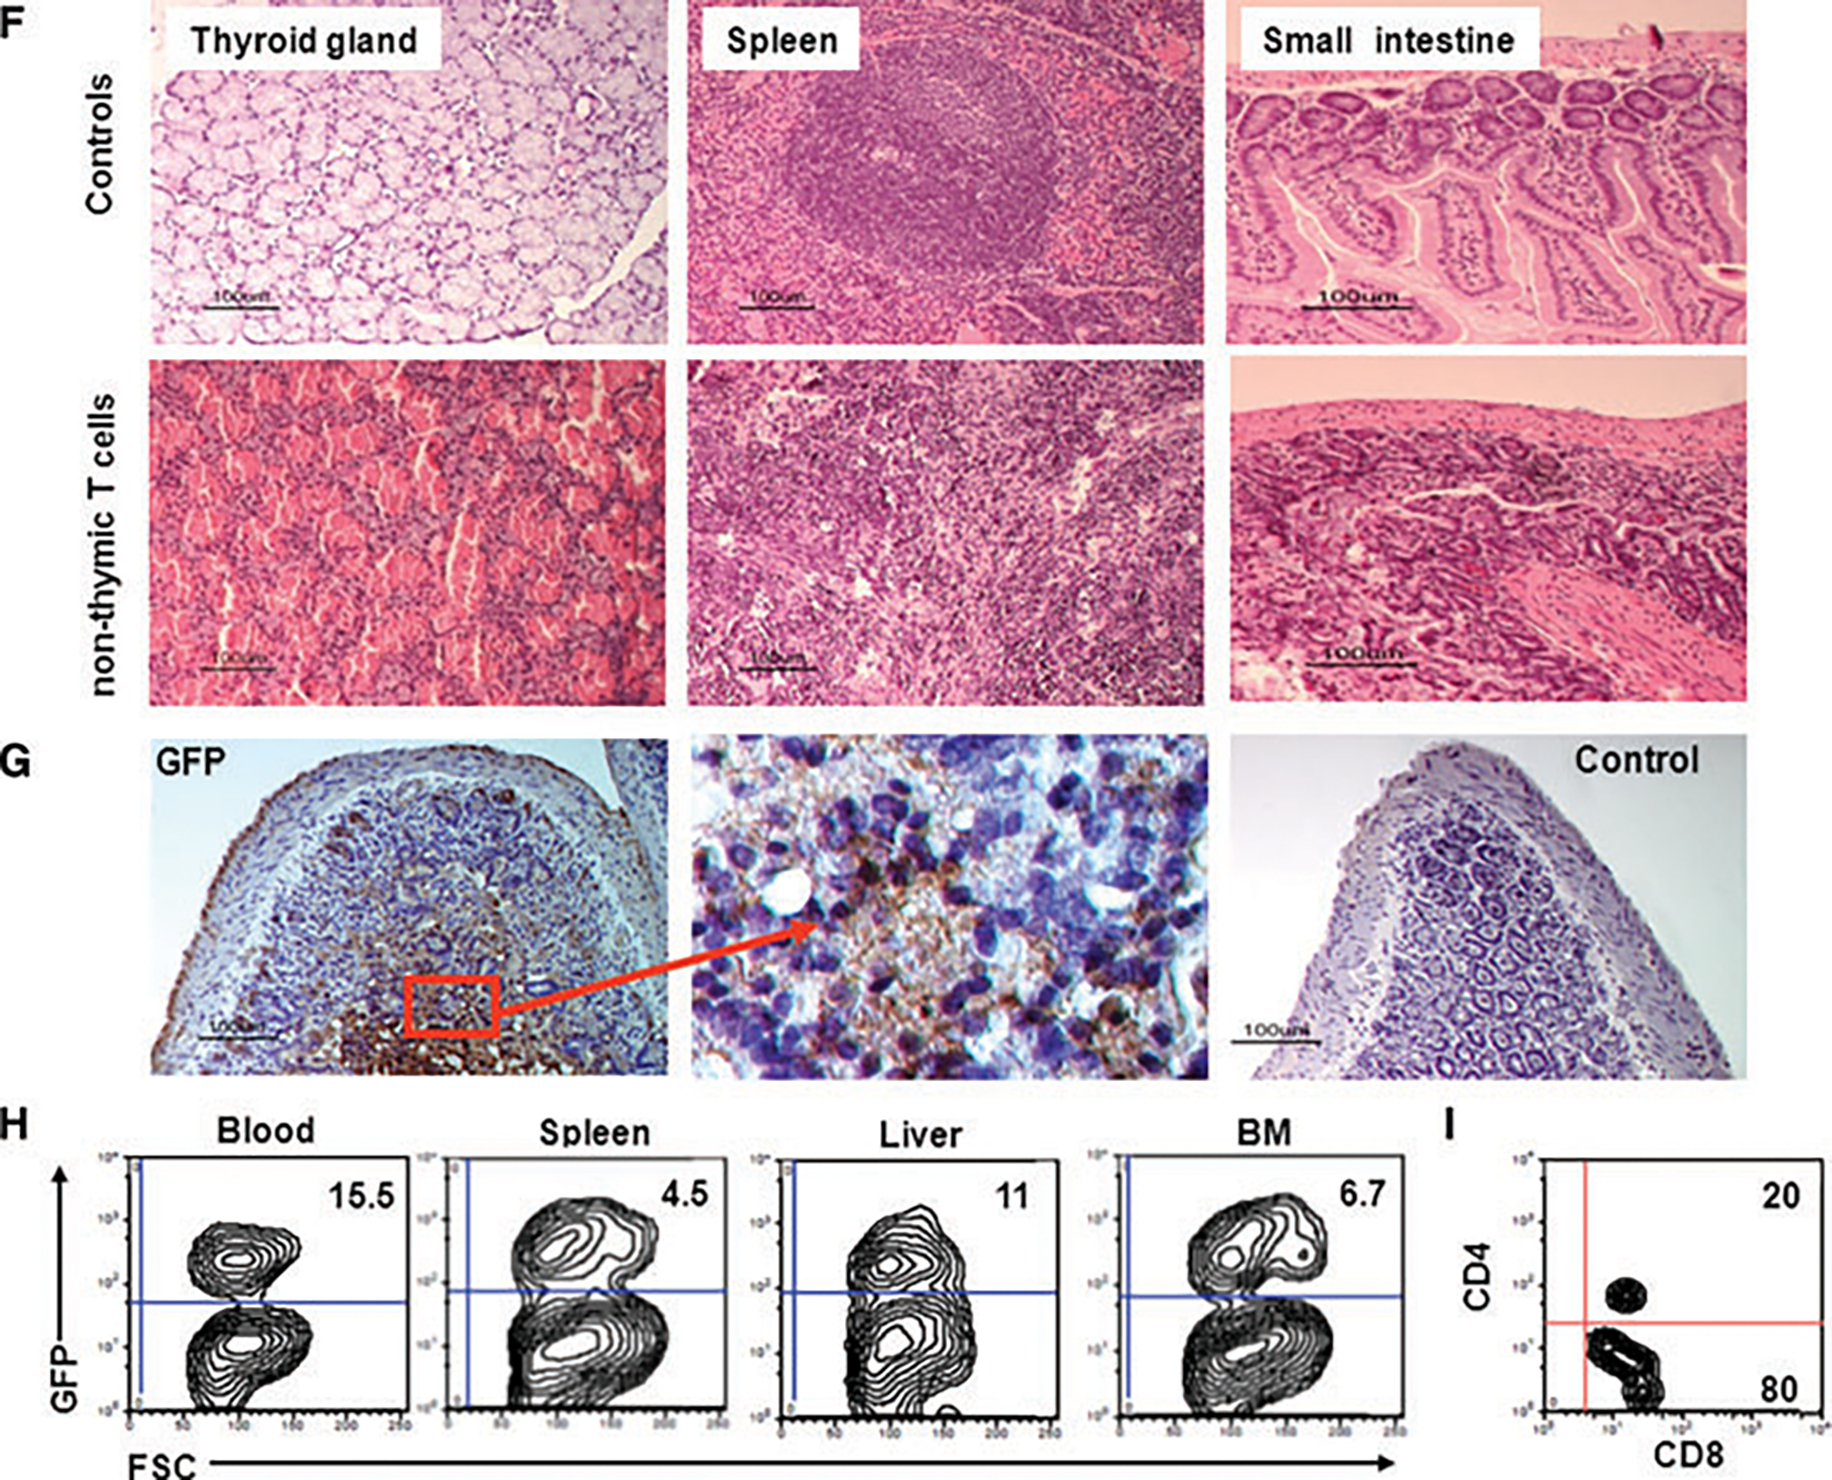
Figure 4: T cells generated in vitro without thymic selection induce lethal GVHD.


(A) Six to eight-week-old 129SvJ mice were infused with 4 × 10⁶ T cells generated without thymic selection. Mice (n = 6) developed restricted cage movements within 2 days. They developed a hunched back posture, diarrhea and lesions around the eyes and paws, consistent with GVHD. (B) Mice that received T cells generated through thymic selection via the FTOCs looked healthy (top) and comparable to their healthy littermates (bottom). In contrast, mice undergoing GVHD (middle) looked smaller and had a hunched posture. (C) The gut of the GVHD mice showed obstruction and thinning. (D) Mice injected with non-thymic T cells (2 × 10⁶ cells) (n = 6) lost weight rapidly whereas mice transplanted with FTOC-T cells maintained and gained some weight within the observation period. (E) The onset and severity of disease was cell number dependent. Here we used 4 × 10⁶ (•), 2 × 10⁶ cells (■) or 105 (▴) non-thymic T cells (n = 6 each). For comparison, we infused six mice each with 105 FTOC-T cells (), all of which thrived. The FTOC-T cells were still detectable by flow cytometry 3 months after transplantation, showing that they survived long term, without causing disease. (F) To confirm GVHD, the gut, spleen and thyroid gland of a representative mouse were examined by H&E staining. The thyroid gland showed heavy mononuclear cell infiltration and obliteration of the glandular structure. Similarly, the spleen had lost the follicular structure and also showed evidence of heavy mononuclear cell infiltration. The small intestines showed infiltration and loss of the crypts and villi, typical of GVHD (n = 6). (G) To confirm that the tissue damage was caused by the infused GFP-expressing T cells, histological sections were stained for GFP by immunohistochemistry. The sections showed dense stains for GFP, confirming that the infused T cells were responsible for the tissue insult (n = 6). (H and I) GFP+ T cells are detectable in peripheral organs during GVHD. Using flow cytometry, we identified robust hematopoietic cell chimerism in the blood, spleen, liver and bone marrow. To characterize for CD4 and CD8, we isolated the splenocytes and gated on the GFP-expressing cells and analyzed them for CD4 and CD8 expression (n = 6) (I). Our data show 80% CD8+ T cells and 20% DP, but no single CD4+ T cells.
