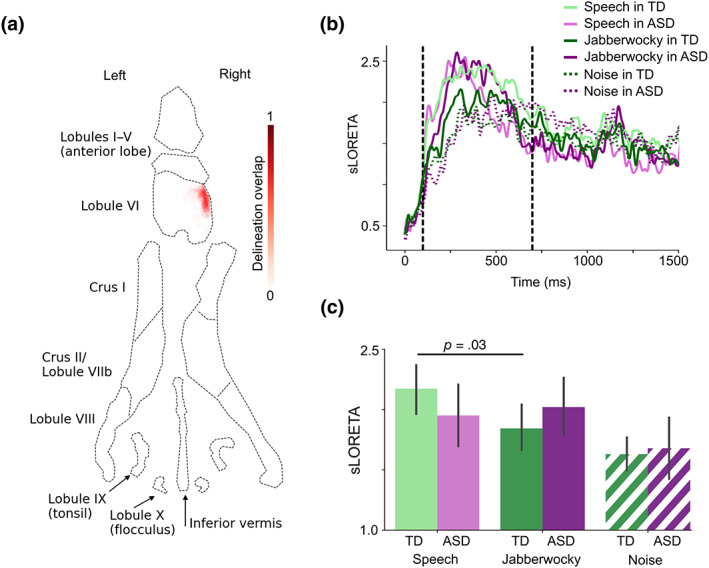
FIGURE 2.

ERFs in right cerebellar lobule VI. (a) Flatmap representation of the cerebellum with probability map of the right lobule VI delineation overlap across participants (N = 51). (b) sLORETA time courses for each group and condition from the region depicted in a. Vertical dashed lines show the time window of interest (100–700 ms after stimulus onset). (c) Bar graph of group means averaged within the time window in B. The p‐value is from a paired‐samples t‐test (two‐tailed). Error bars represent standard error of the mean. See Figure S3 for the cortical ERFs.
