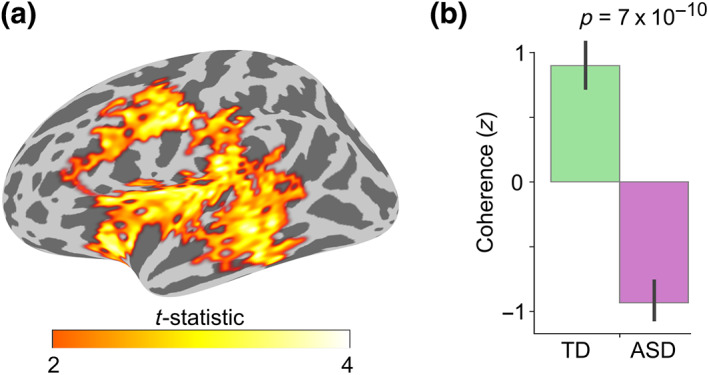
FIGURE 3.

Group difference in the Speech versus Jabberwocky functional connectivity with the right cerebellar lobule VI seed. (a) Spatial extent of the spatio‐temporal group difference cluster depicted on inflated left lateral cerebral hemisphere. The spatial cluster representation was derived by collapsing the temporal dimension by selecting the time point of the largest group difference for each vertex. (b) Bar graph of group means with p‐value from two‐sample t‐test (two‐tailed). Coherence values were averaged within the whole spatio‐temporal cluster, corrected for NVIQ, and the residuals were z‐scored. Error bars represent standard error of the mean.
