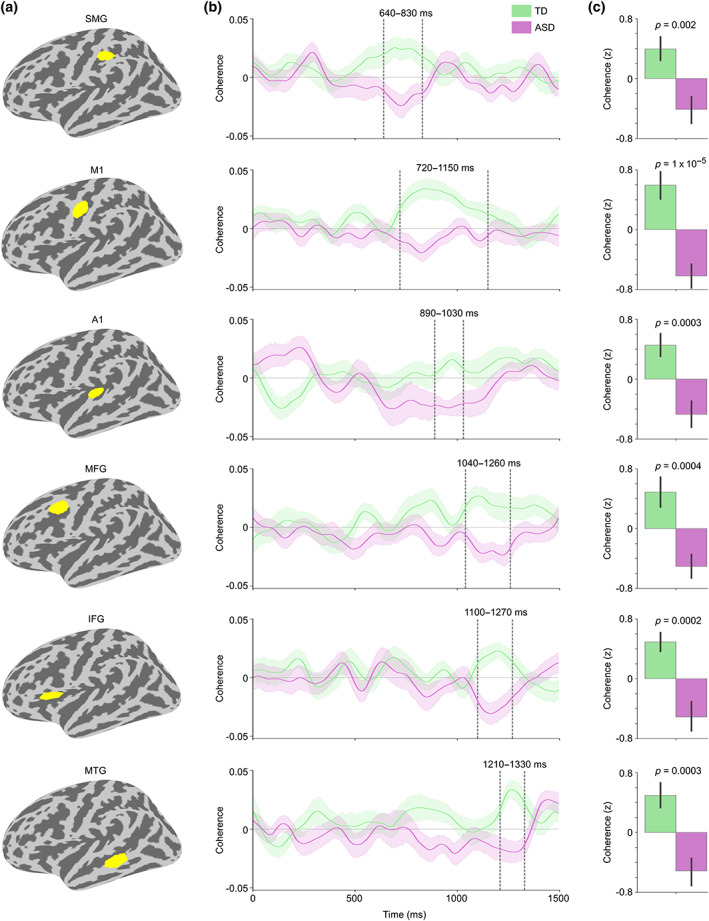
FIGURE 4.

Coherence between right cerebellar lobule VI and cortical ROIs for Speech versus Jabberwocky in TD and ASD groups. (a) ROIs from top to bottom: supramarginal gyrus (SMG), primary motor cortex (M1), primary auditory cortex (A1), middle frontal gyrus (MFG), inferior frontal gyrus (IFG), and middle temporal gyrus (MTG). (b) Right lobule VI seed coherence time courses from the ROIs in TD and ASD groups. Vertical dashed lines show time windows of significant group difference in the permutation test (also marked above the time windows). The ROI time courses are arranged from the earliest to the latest significant group difference. Shaded areas around the group mean time courses indicate standard error of the mean. (c) Bar graph of group means averaged within the time windows in b with p‐values from two‐sample t‐tests (two‐tailed). Coherence values were corrected for NVIQ and the residuals were z‐scored. Error bars represent standard error of the mean.
