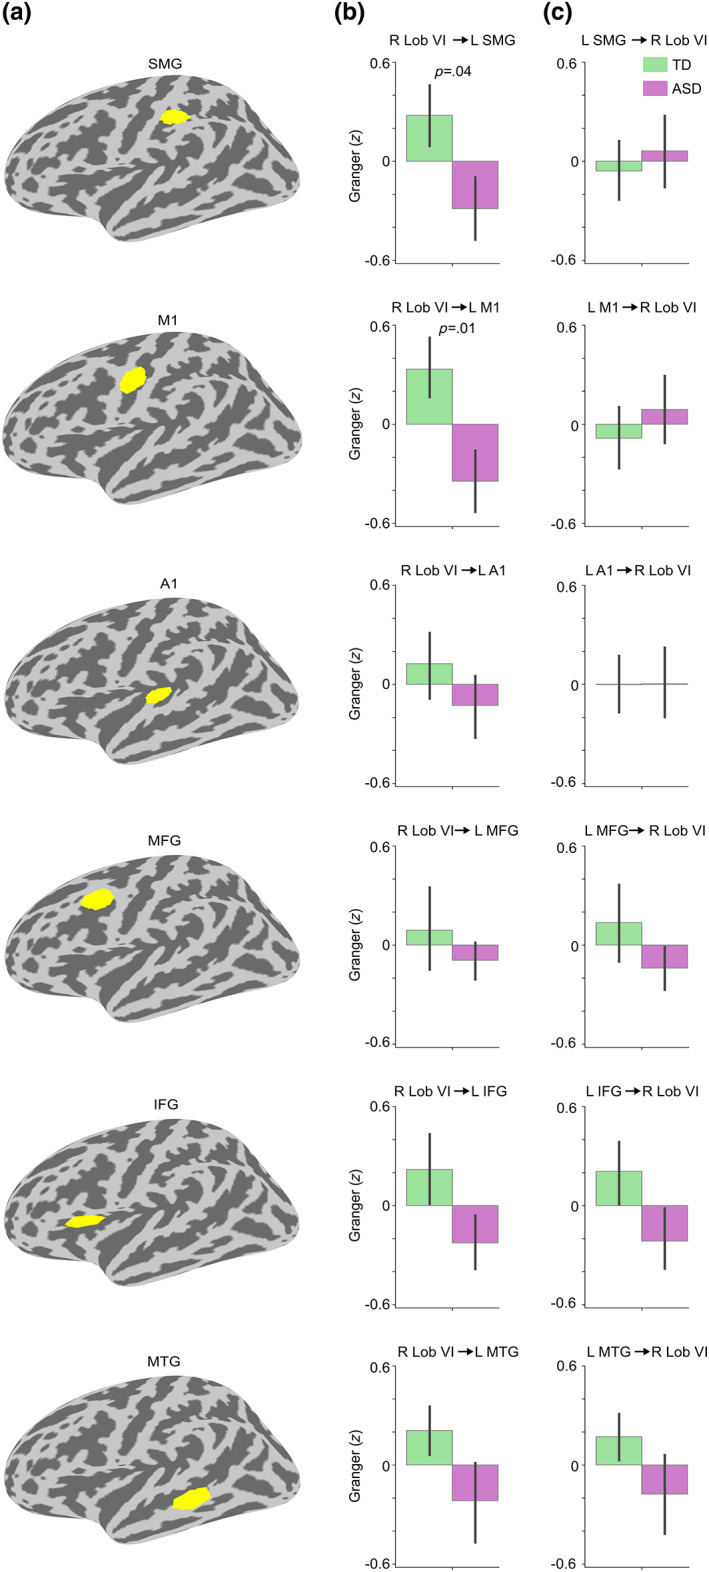
FIGURE 5.

Directionality of the Speech versus Jabberwocky connectivity between right lobule VI and cortical ROIs. (a) The cortical ROIs depicted on left hemisphere inflated surface. The ROIs are arranged based on the latency of the group difference in the right lobule VI seed coherence (from the earliest to the latest; see Figure 4). (b) Bar graphs of group means for the directed connection from right lobule VI to the ROIs. (c) Bar graphs of group means for the directed connection from the ROIs to right lobule VI. In b and c, the direction of the connectivity is shown on top of the graphs. For significant group differences, the p‐value from the two‐sample t‐test (two‐tailed) is shown on top of the bar graph. The Granger causality was estimated using 8–12 Hz center frequencies and sliding window center points matching the ROI‐specific group difference time windows (see Figure 4) rounding the beginning down and the end up to the nearest 50 ms. For example, the Granger causality sliding window center points for SMG were 600–850 ms. Error bars around the mean represent standard error of the mean. Granger causality values were corrected for NVIQ and the residuals were z‐scored. L, left; R, right.
