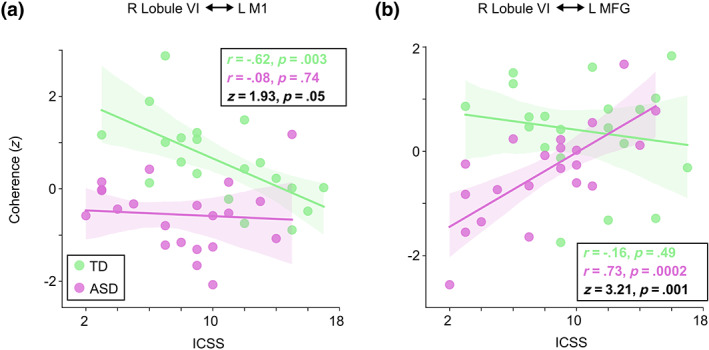
FIGURE 8.

Correlation between attentional inhibition (ICSS) and Speech versus Jabberwocky functional connectivity between right lobule VI and left cortical ROIs. a) Scatter plot of ICSS against Speech versus Jabberwocky coherence between right lobule VI and left M1 within the 720–1150 ms group difference time window (see Figure 4). b) Scatter plot of ICSS against Speech versus Jabberwocky coherence between right lobule VI and left MFG within the 1040–1260 ms group difference time window. The coherence values were adjusted for NVIQ and the residuals were z‐scored. The shaded areas around the regression line encompass the 95% confidence interval for the correlation. Correlation coefficient (r) and p‐value from Pearson correlation test (two‐tailed) for the within‐group correlations as well as Fisher r‐to‐z transformed z‐scores and p‐values for the difference between the within‐group correlations are shown in each plot.
