
FIGURE 2.
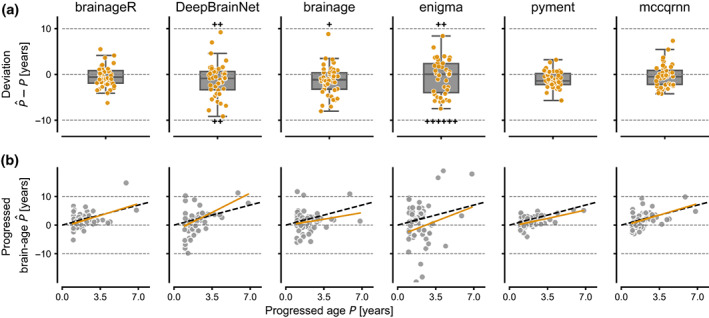
(a) Deviation between progressed brain age and the progressed chronological age for subjects with more than 1 year between MR scans. The boxplot represents the median and quartiles of the data, and the whiskers 1.5× the interquartile range. For visualization purposes, some outliers are not shown, but are instead represented by the plus‐sign to indicate their quantity and respective direction. (b) Association between chronological progressed age and progressed predicted age. The dashed black line represents the identity line, and the yellow line the fitted regression line from the LME.