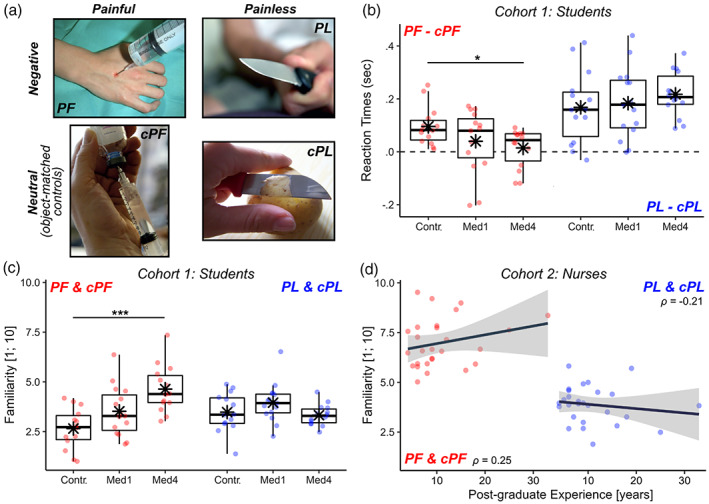
FIGURE 1.

Handedness task. (a) Example for each stimulus category. cPF & cPL, respective neutral control conditions; PF, painful; PL, negative painless. (b, c) From cohort 1, boxplots displaying mean online Response Times of correct responses and post‐scanning familiarity ratings. Response Times are displayed as differential seconds between each emotional condition and its neutral control. Familiarity values are displayed as average scores between each conditions and its' control, and range from 1 (not familiar at all) to 10 (extremely familiar). For each boxplot, the horizontal line represents the median value of the distribution, the star represents the average, the box edges refer to the inter‐quartile range, and the whiskers represent the data range within 1.5 of the inter‐quartile range. Individual data‐points are also displayed color coded, with red dots referring to PF/cPF stimuli, and blue dots to NPL/cNPL stimuli. Contr., controls; Med1 & Med4, university students enrolled at the first/fourth year of medicine. “***” and “*” refer to significant group differences as tested through linear mixed models (see methods) at p < .001 and p < .05 respectively. (d) From cohort 2, scatter plot displaying post‐scanning Familiarity ratings against post‐graduate EXPERIENCE. Each plot is described though a regression line, 95% confidence interval area, color‐coded data points, and a Spearman's rank‐correlation coefficient ρ. For comparability purposes, Familiarity scores in subplots (c) and (d) are displayed on the same scale.
