FIGURE 2.

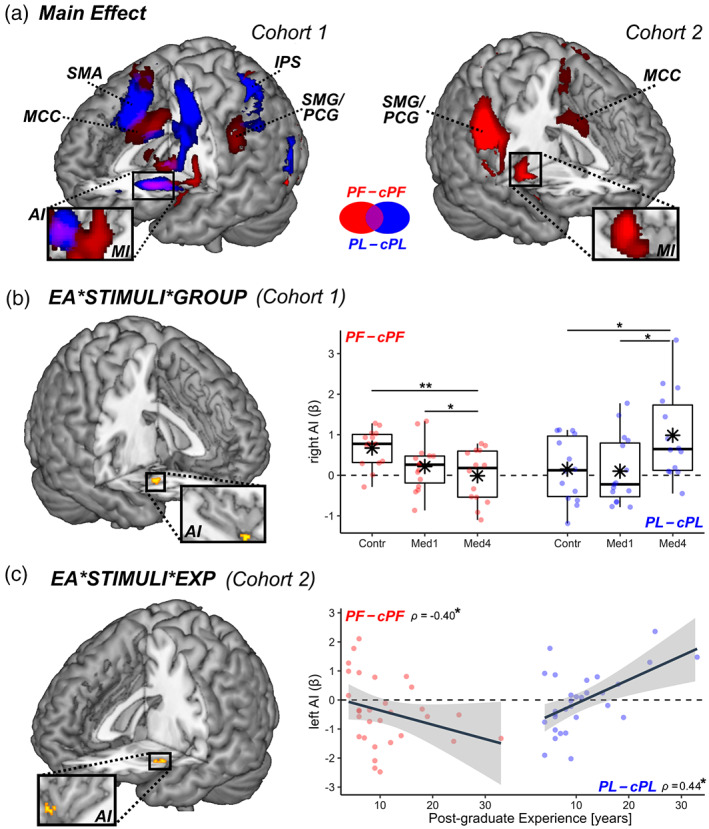
Handedness task. Surface rendering of brain regions associated with (a) the main effect of PF–cPF (red blobs) and PL–cPL (blue blobs) across in both cohorts. IFG, inferior frontal gyrus; MCC, middle cingulate cortex; MI & AI, middle & anterior insula; PCG, postcentral gyrus; PreC, precentral gyrus; SMA, supplementary motor area; SMG, Supramarginal Gyrus. (b) In Cohort 1, regions associated with the three‐way interaction between Emotional Arousal (EA), Stimuli, and Group (where “Group” refers to the difference between Control and Med4 students). All activated regions are displayed under TFCE correction for multiple comparisons for the whole brain or mask of interest (see methods). Detailed coordinates are listed in Tables S2–S4. Activity parameters extracted from the highlighted region are plotted according to groups. Individual data‐points are also displayed. Red dots refer to PF–cPF activity, whereas blue dots refer to PL–cPL activity. “**,” and “*” refer to significant group differences (tested through independent sample t‐test) at p < .01 and p < .05, respectively. (c) In Cohort 2, regions associated with the three‐way interaction between EA, Stimuli, and post‐graduate Experience. Parameters extracted from the highlighted region are displayed in a scatter plot, describing differential PF–cPF or PL–cPL activity against experience. “*” refers to Spearman's rank‐correlation coefficient ρ associated with p < .05.
