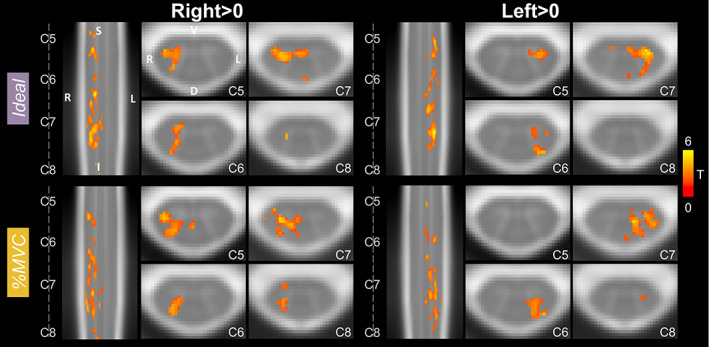
FIGURE 2.

Spinal cord hand‐grasp group‐level activation maps. Activation maps for each model (Ideal, %MVC) for the Right Grasp > 0 and Left Grasp > 0 contrasts. Significant t‐statistics are shown (p < .05, FWE‐corrected). One representative sagittal slice and four axial slices within each spinal cord segment are shown. Probabilistic spinal cord segments are indicated. Note, images are in radiological view.
