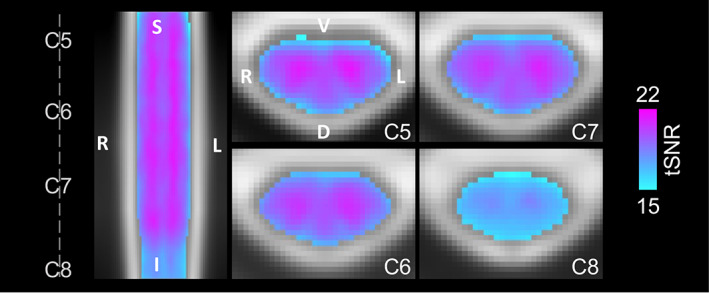
FIGURE 3.

Group average tSNR map after denoising. The tSNR after modeling with the Ideal regressor was calculated for each subject and scan, warped to PAM50 template space, and averaged voxelwise across all subjects and scan sessions. The same representative sagittal and axial slices as Figure 2 are shown. The average gray matter tSNR across spinal cord segments is C5: 20.14, C6: 20.18, C7: 20.07, and C8: 17.80. The average white matter tSNR across spinal cord segments is C5: 18.30, C6: 18.65, C7: 18.64, and C8: 16.92. See Figure 4c for a depiction of the spinal cord segment masks tSNR was calculated within. Only one map is shown because there is no visually discernable difference between the tSNR maps after denoising using the Ideal or %MVC model.
