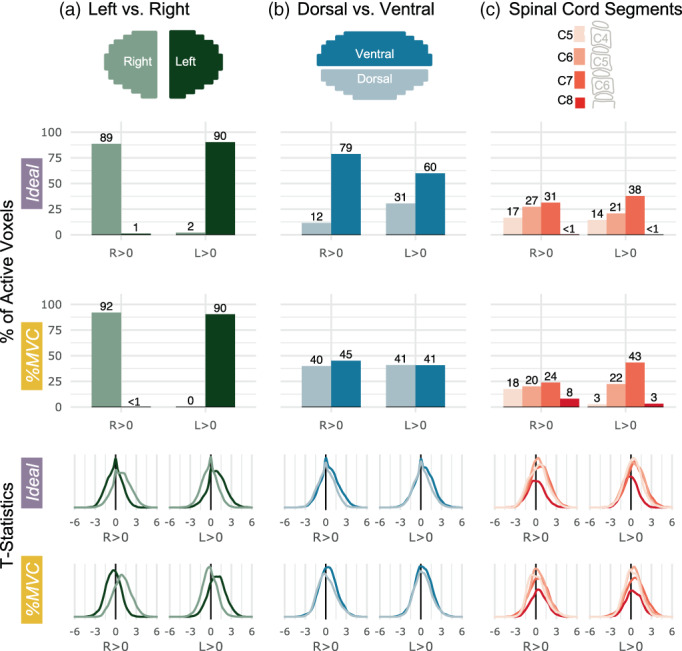
FIGURE 4.

Spatial distribution of significantly active voxels in spinal cord ROIs for Ideal and %MVC models for grasping with the right and left hands. Schematic representations of the ROI masks are shown in the top row. (a) The percent of total active voxels and distribution of t‐statistics in the left and right hemicords. The left and right hemicord masks have a 3‐voxel midline between the masks. (b) The percent of total active voxels and distribution of t‐statistics in the ventral and dorsal hemicords. (c) The percent of total active voxels and distribution of t‐statistics that are in spinal cord segments C5–C8. Probabilistic spinal cord segments were thresholded and binarized to create segment masks. Note, active voxels are tallied within these probabilistic masks so there are many voxels not counted as they fall between these segment ROIs. The C8 segment is only partial because it is at the boundary of the field of view. Percentages do not add up to 100 because some active voxels may not fall outside of the ROI mask bounds.
