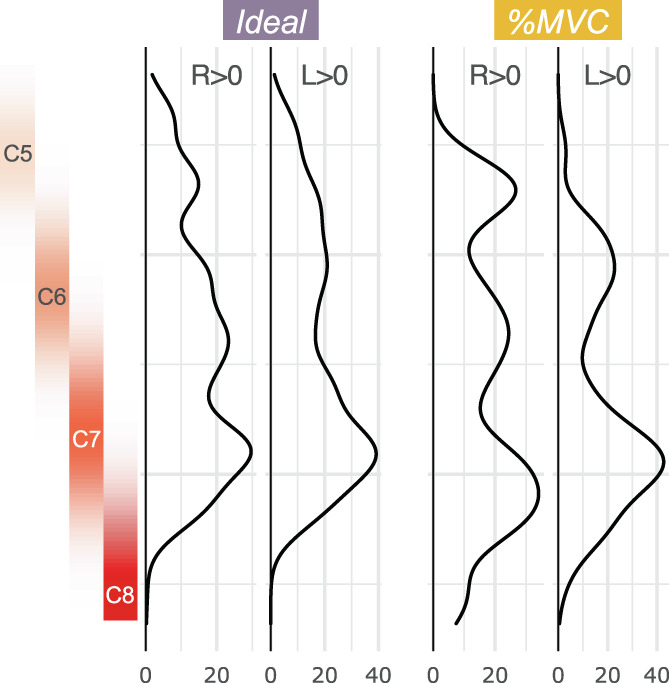
FIGURE 5.

Rostrocaudal distribution of hand‐grasp motor activation for the Ideal and %MVC models. The number of active voxels in each axial slice of the group‐level activation maps is represented by a density plot for the right and left grasping tasks. Probabilistic spinal cord segments are shown to the left. The activation peak is in the C7 spinal cord segment; however, substantial activation is observed throughout the cord.
