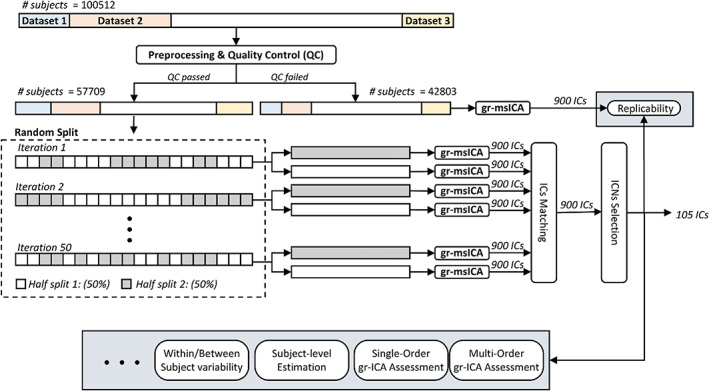
FIGURE 1.

Analysis pipeline. Data of 100,512 subjects went through preprocessing and quality control (QC). In total, 57,709 subjects passed the QC and were used to generate the template. The QC‐passed dataset was randomly split in half, and group‐level multi‐spatial‐scale independent component analysis (gr‐msICA) was applied on each half‐split to generate 900 independent components (ICs). This process was repeated independently 50 times, which resulted in 100 sets of 900 ICs. Next, the 900 most stable ICs were identified and labeled as non‐ICNs or ICNs, and the 105 most distinct (spatial similarity <0.8) were selected as the ICN template. Finally, several group‐level and subject‐level analyses were performed.
