
FIGURE 2.
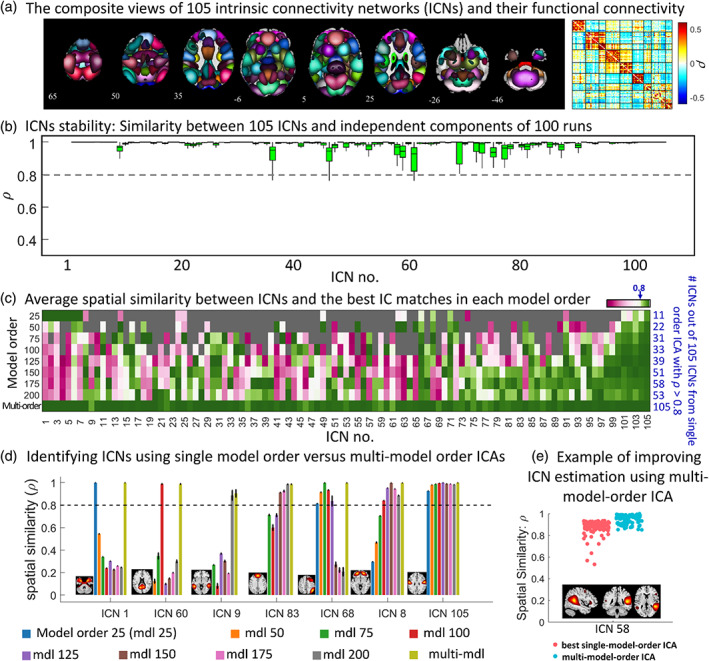
Group‐level multi‐spatial‐scale independent component analysis (gr‐msICA) results. (a) The composite views of the 105 selected intrinsic connectivity networks (ICNs) and averaged whole‐brain functional connectivity. Each ICN spatial map was first z‐scored and thresholded at z‐value = 1.96 (p‐value = .05). Whole brain functional connectivity was estimated by calculating the Pearson correlation between each pair of ICNs and averaged across the QC‐passed dataset. (b) Multi‐model order stability. The spatial similarity of ICNs with corresponding independent components (IC) across 100 gr‐msICA runs on different halves of the QC‐passed dataset. (c) single‐model‐order versus multi‐model‐order ICA. The average spatial similarity is computed between each ICN and the best IC matches across the 100 runs in each model order (and multi‐model‐order). The blue values on the right side indicate the number of ICNs identified by each model order using the similarity threshold of 0.8 (similar to stability coefficient = 0.8). (d) Different ICNs can be identified using different ranges of model orders. For example, ICN 105 was successfully identified by all model orders used in this study. (e) an example showing how using msICA improves the identification of the best corresponding ICN across different subsets of data, suggesting msICA improves the identification of ICNs across datasets.