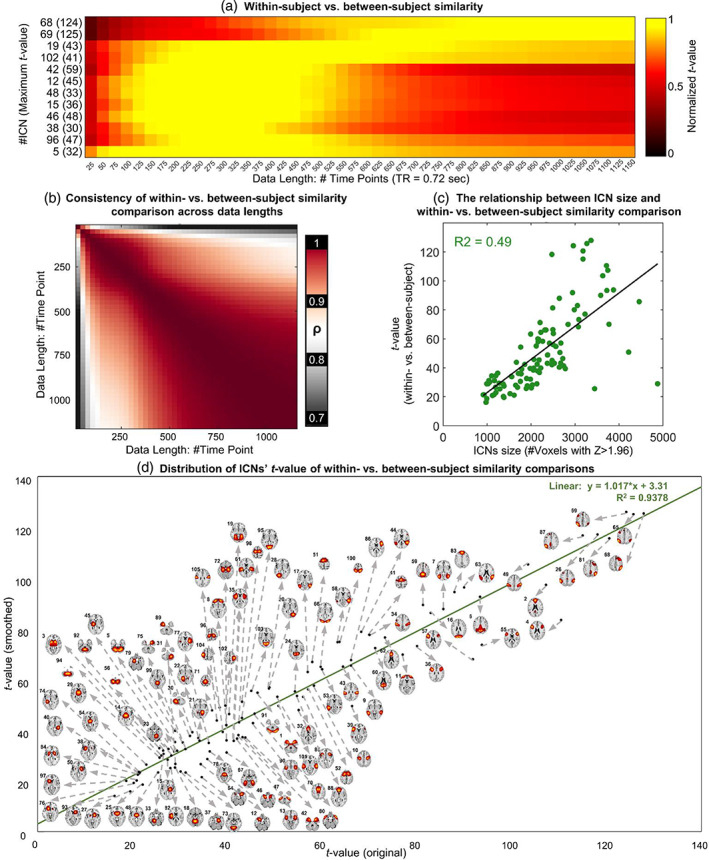
FIGURE 6.

Within‐subject versus between‐subject comparison. Panel (a) shows examples of this comparison for selected ICNs and different data lengths. Panel (b) illustrates similarity in ICNs' t values across different data lengths. (c) The relationship between the t‐value of within‐ versus between‐subject comparison and the size of the ICNs. Panel (d) demonstrates that the subject‐specificity pattern is similar for original estimations and smoothed ones and the distribution of ICNs' subject‐specificity power.
