FIGURE 3.

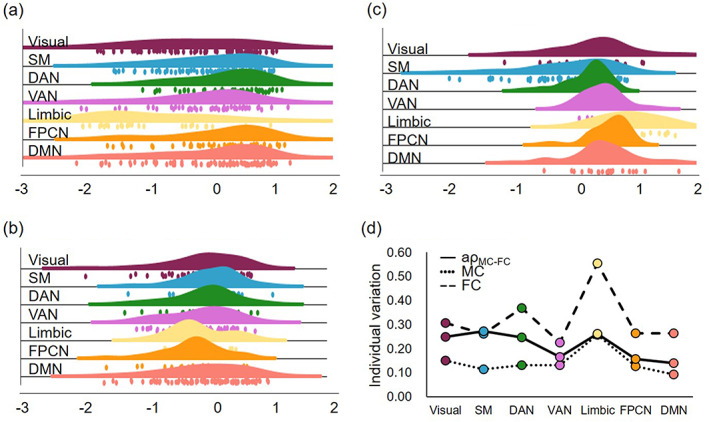
Comparison of one modality MC, FC and coupling value. The histogram distribution of (a) MC, (b) FC, (c) in each brain network. (d) The individual variation of MC, FC, and in each brain network.

Comparison of one modality MC, FC and coupling value. The histogram distribution of (a) MC, (b) FC, (c) in each brain network. (d) The individual variation of MC, FC, and in each brain network.