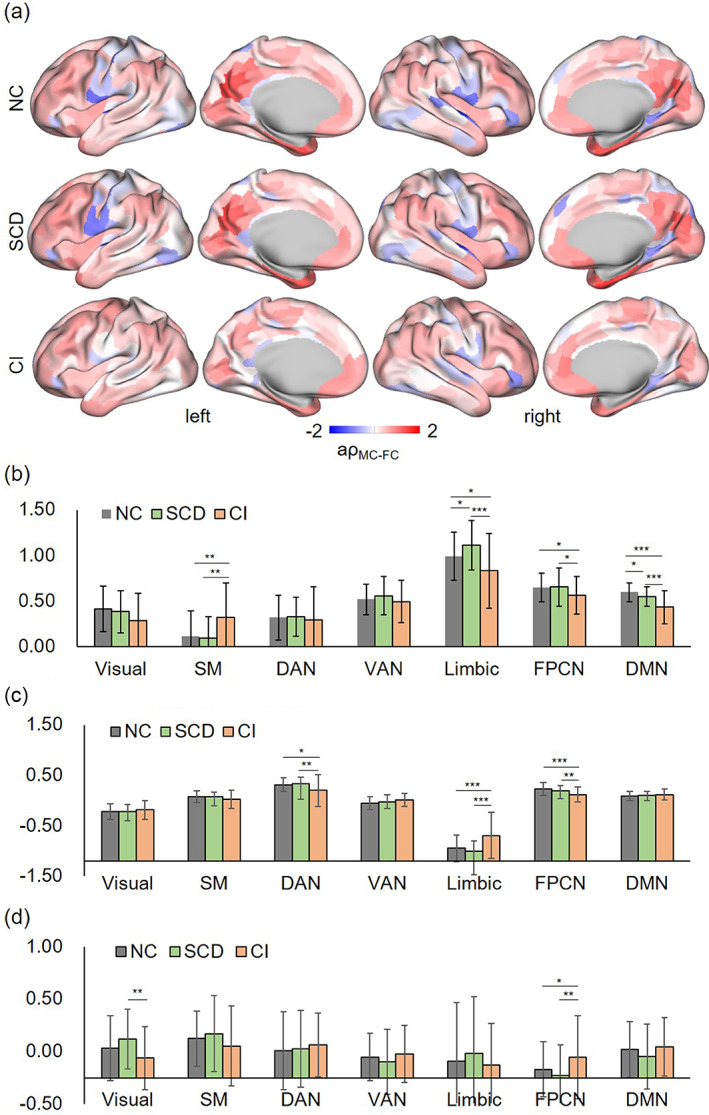
FIGURE 4.

Results of abnormal areas along the AD continuum. (a) The mean coupling value of each brain areas in HC, SCD, and CI group. (b) Pairwise post hoc analysis results across three groups based on coupling value, (c) MC, and (d) FC index. *p < .05, **p < .01, ***p < .001.
