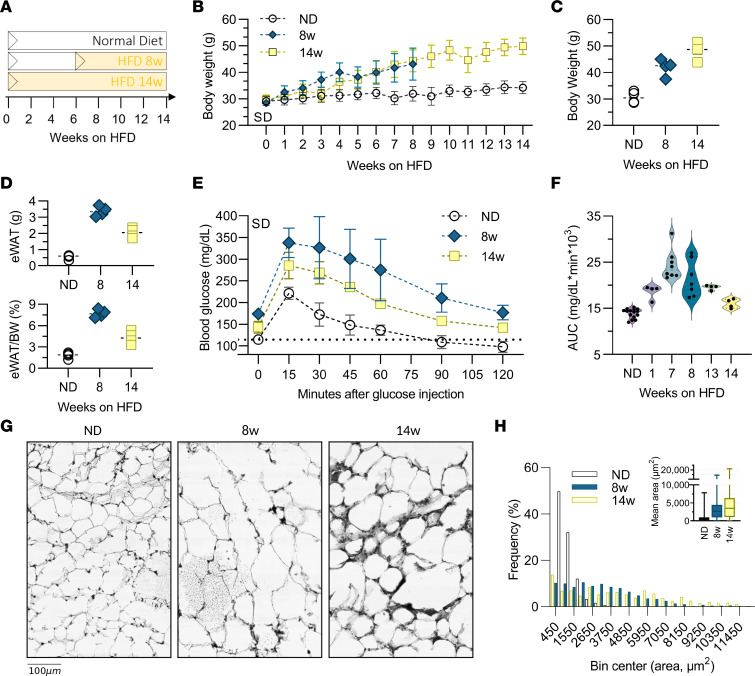
Figure 1. Diet-induced obesity and adipose tissue remodeling.
(A) Time course for mice fed a 60% HFD for 8 weeks (8w) or 14 weeks (14w) versus ND controls. (B) Total BW by week on HFD. (C) Final BW at time of tissue collection. (D) eWAT weight (top) and eWAT as a percentage of BW (bottom). (E) Glucose measurements in cohorts 1 week prior to endpoint tissue collection. (F) GTT data showing AUC. (G) H&E-stained adipose tissue sections of eWAT from cohorts. (H) Frequency distribution and average adipocyte size in eWAT from cohorts. (B–E) For each group, n = 4. (F) For HFD-fed mice, n = 4–8 mice per group; for ND, n = 15 mice.

