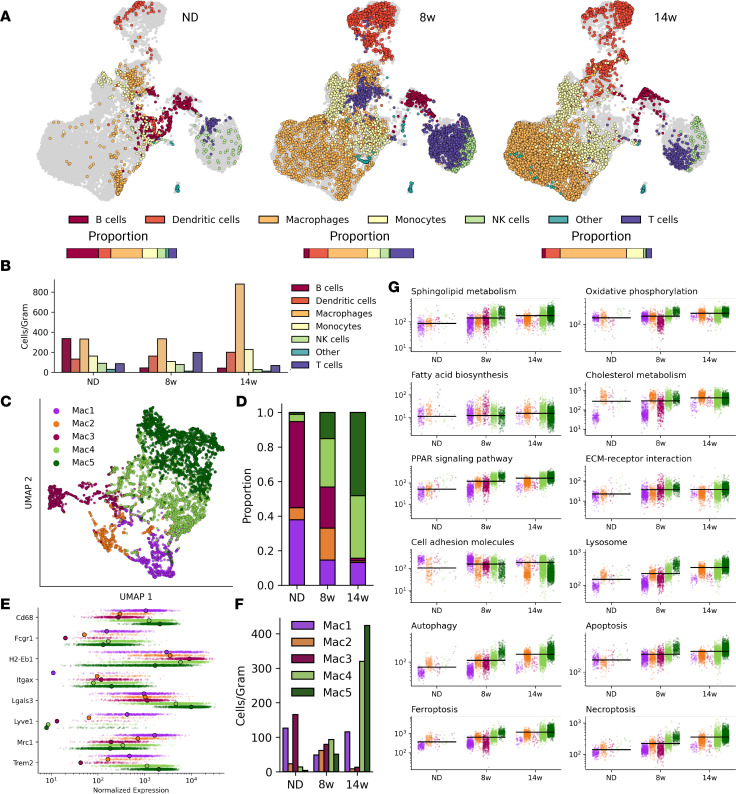
Figure 2. Single-cell data on macrophage phenotypes in obesity.
(A) Immune-cell population changes over the course of diet-induced obesity. (B) The number of cells per gram of adipose tissue for each cell type in each diet condition. (C) UMAP visualization of ATM clusters from scRNA-Seq data. (D) Proportions of each ATM cluster at each time point. (E) Expression of key genes across ATM subtypes. Large points represent mean expression for the subtype. (F) ATM subtypes per gram of tissue sampled for each diet condition. (G) Changes in mean expression of genes in select Kyoto Encyclopedia of Genes and Genomes pathways in the macrophage subpopulations. Black lines represent mean macrophage expression of pathway genes in each diet condition. 8w, 8 weeks; 14w, 14 weeks; ECM, extracellular matrix.

