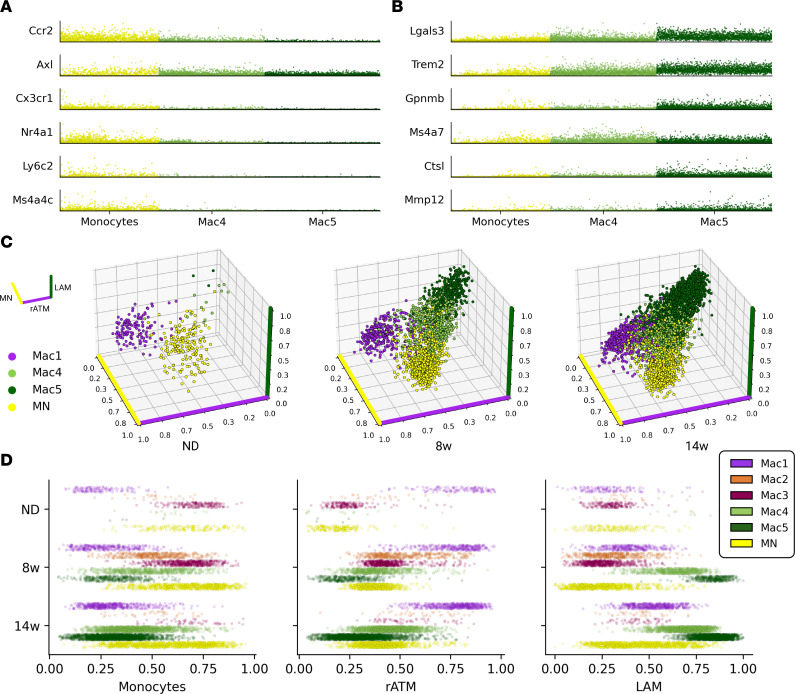
Figure 3. Emergence of the LAM phenotype.
(A) Normalized expression of MN marker genes for key myeloid cell types. (B) Normalized expression of LAM marker genes for key myeloid cell types. (C) 3D profiling of MNs, resident ATMs (Mac1), and LAMs (Mac4, Mac5). Cell position represents simultaneous Pearson correlation with gene expression signatures derived from MNs (yellow axis), resident ATMs (rATM; purple axis), and LAMs (green axis). (D) Macrophage subtype correlations with MN, rATM, and LAM expression signatures for each diet condition. 8w, 8 weeks; 14w, 14 weeks.

