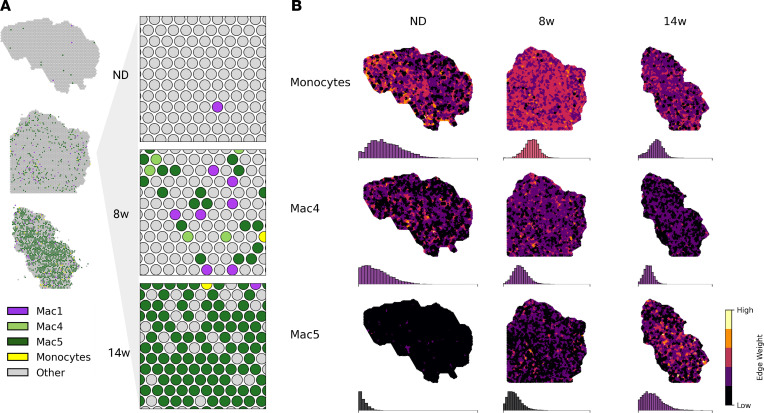
Figure 4. Spatial patterning of the MN-LAM lineage.
(A) Overview of CARD-predicted cell-type proportions for myeloid cell types over the course of HFD feeding. (B) Spatial patterning of MNs, pre-LAMs (Mac4) and LAMs (Mac5) over the course of HFD feeding. Edge weights are the harmonic mean of CARD proportions for neighboring capture spots. Histograms show the distribution of edge weights for the whole tissue section and are colored according to the mean edge weight on the same color scale. 8w, 8 weeks; 14w, 14 weeks.

