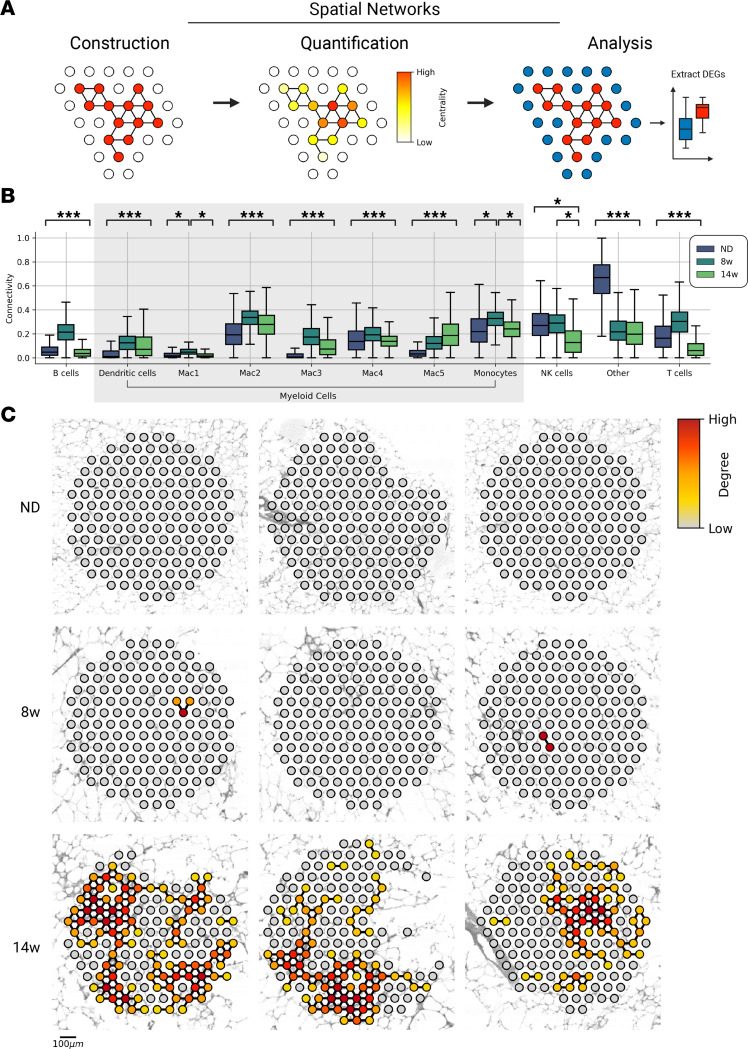
Figure 5. LAM networks are hubs of cell death.
(A) Workflow schematic. Network models are defined on the basis of properties of neighboring tissue spots. Analysis of network structure reveals principals of tissue organization. Differential expression analysis may be used to characterize the transcriptional signature of niches. (B) Connectivity of tissue-wide networks for all immune-cell types over time. Connectivity is the distribution of network edge weights, defined as the harmonic mean of CARD-predicted proportions between neighboring spots. ***P = 0.01 by Student’s t test for comparison between each time point (i.e., ND vs. 8 weeks [8w], 8w vs. 14 weeks [14w], and ND vs. 14w); *P ≤ 0.01 for specific comparison. (C) Nine randomly sampled 150-node networks based on LAM signature (Mac5) over time. DEG, differentially expressed gene.

