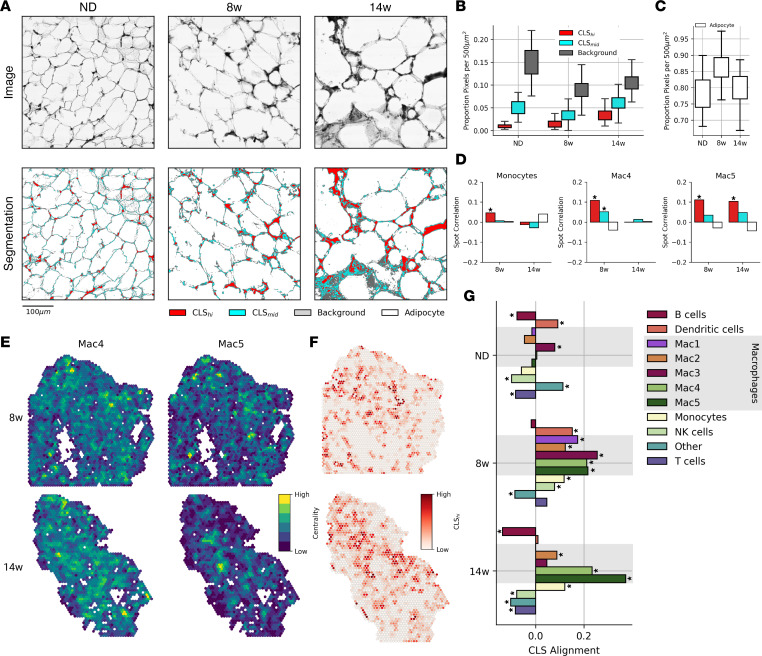
Figure 6. Histological quantification of CLSs.
(A) H&E-stained images captured during spatial transcriptomics library preparation (top) and segmentation results quantifying CLSs (bottom). (B) Segmentation class label proportions of 100 randomly sampled 500 μm regions from each diet condition. (C) Adipocyte area from images regions in B. (D) Spot correlation between myeloid cell-type proportions and segmentation results from a 150 μm region around each capture spot. Spots with read counts below the 0.05 quantile were removed. *P ≤ 0.01 by Pearson correlation. (E) Spot importance in global cell-type networks (eigenvector centrality) in HFD feeding conditions. Eigenvector centrality highlights regions of densely localized cells in the tissue. (F) CLShi segmentation results in 150 μm regions around each capture spot at 8 weeks (8w) and 14 weeks (14w). (G) CLS alignment represents the Pearson correlation between CLShi segmentation results and cell type–specific eigenvector centrality for each diet condition. *P ≤ 0.01 by Pearson correlation. Spots with read counts below the 0.05 quantile were removed.

