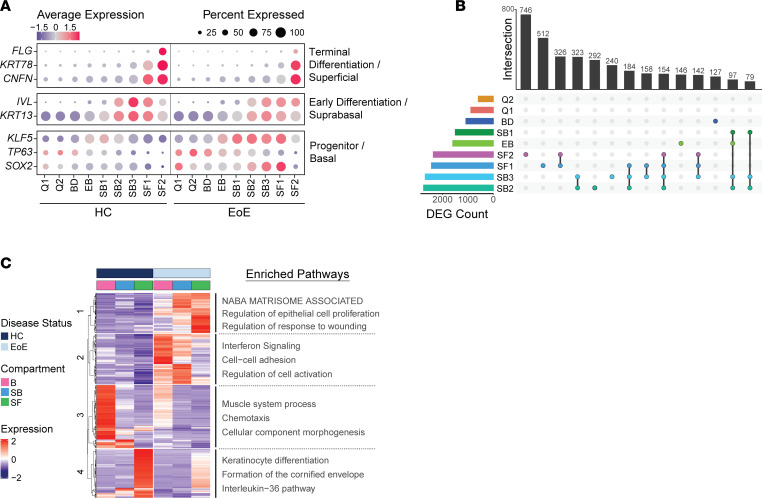
Figure 4. Characterization of the transcriptional changes in the suprabasal and superficial EEC compartments in EoE.
(A) Cluster average expression Z scores of EEC markers in HC and EoE. Color gradient indicates the average gene expression per cluster; dot size indicates the percentage of cells exhibiting gene expression per cluster. (B) UpSet plot displaying the number of DEGs per EEC cluster, calculated between EoE and HC. Total DEG counts per cluster and unique DEG intersections are shown as bar plots. Intersections are ordered from greatest to least, with the top 14 visualized. (C) Heatmap of log2 normalized Z score expression of DEGs across all EEC, calculated between EoE and HC (|logFC| > 1, FDR-adjusted P < 0.05). Top hierarchical clusters are displayed with enriched pathways. B, Basal; Q, Quiescent; BD, Basal_Dividing; EB, Epibasal; SB, Suprabasal; SF, Superficial.

