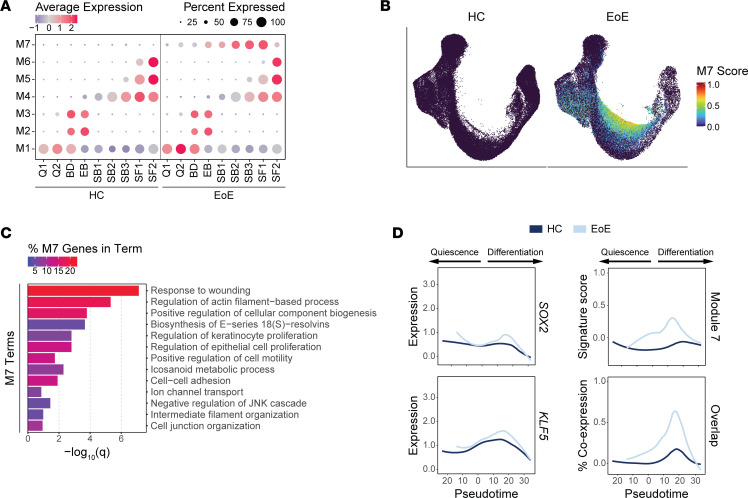
Figure 8. Pseudotemporal trajectory-dependent gene programs are altered in EEC in EoE.
(A) Average signature score Z scores per EoE trajectory–dependent module for each epithelial cluster in HC or EoE. Color intensity indicates relative scoring. (B) UMAP of the merged scRNA-Seq data set of EEC from HC or EoE, colored by module 7 gene signature score. (C) Enriched pathways for module 7 genes, ranked by P value. Color intensity indicates the percentage of module 7 genes along each pathway. (D) Expression of SOX2, KLF5, or module 7 genes across EEC and percentage of EEC expressing meaningful levels of all 3 conditions, ordered by pseudotime for both HC and EoE. Lines represent moving averages calculated by LOESS regression. B, Basal; Q, Quiescent; BD, Basal_Dividing; EB, Epibasal; SB, Suprabasal; SF, Superficial.

