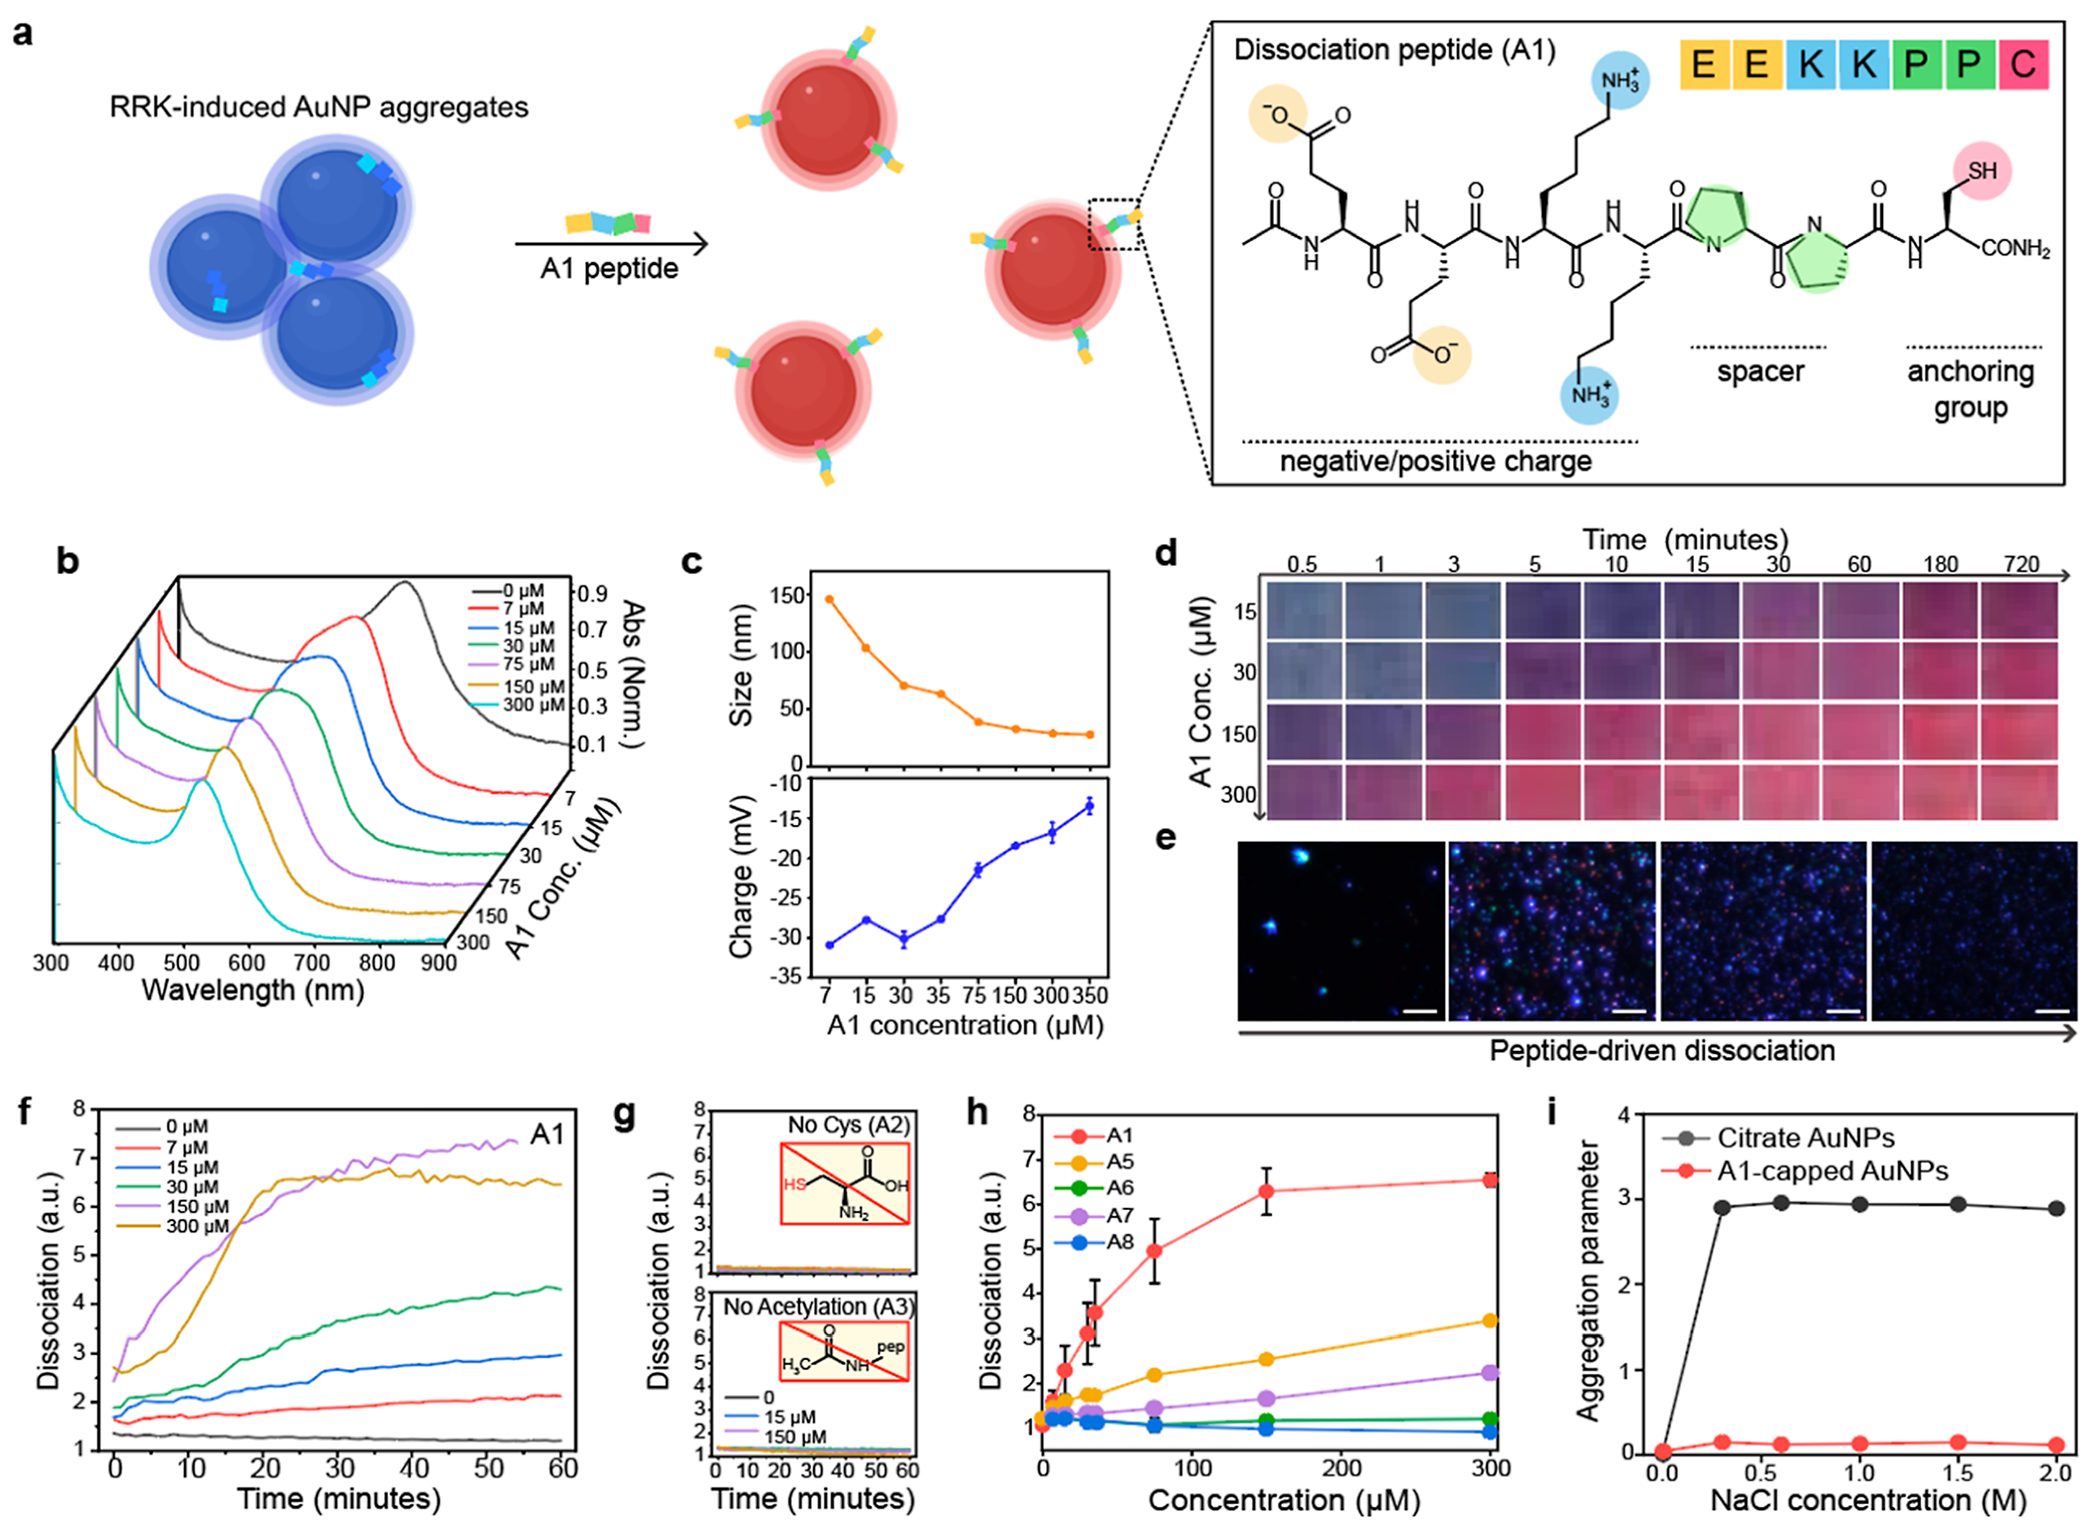
Figure 2.

Peptide-enabled dissociation of AuNP aggregates. (a) Schematic illustration of peptide-based particle dissociations. AuNP aggregates induced by RRK peptides were reversibly dissociated by the A1 peptides. The structural component of the A1 peptide contains charge, spacer, and anchoring group. (b) UV–vis spectrum shows that the plasmonic resonance peak of AuNP aggregates blueshifted upon addition of the A1 peptide (7–300 μM). (c) Hydrodynamic diameter and the surface charge after adding the A1 peptide. (d) Time-dependent photographs show 150 μM of the A1 peptide required to dissociate AuNP aggregates. x and y axis indicate time and the A1 concentration, respectively. (e) Darkfield images of AuNP aggregates (left) and the dissociated AuNPs (right). The scale bar indicates 10 μm. Blue dots represent actual AuNPs dissociated by the A1 peptide. (f) Time-dependent particle dissociation driven by the A1 peptide. The ratiometric signal (λ520/λ700) was referred to as dissociation (y axis). (g) Particle dissociation was quenched without Cys (A2) and acetylation (A3). (h) Dissociation capacity of the A1, A5, A6, A7, and A8 peptides. (i) Dissociated AuNPs by the A1 (red) showed higher colloidal stability than citrate-coated AuNPs (black). Panel (c,h,i) repeated three independent times and showed similar results.
