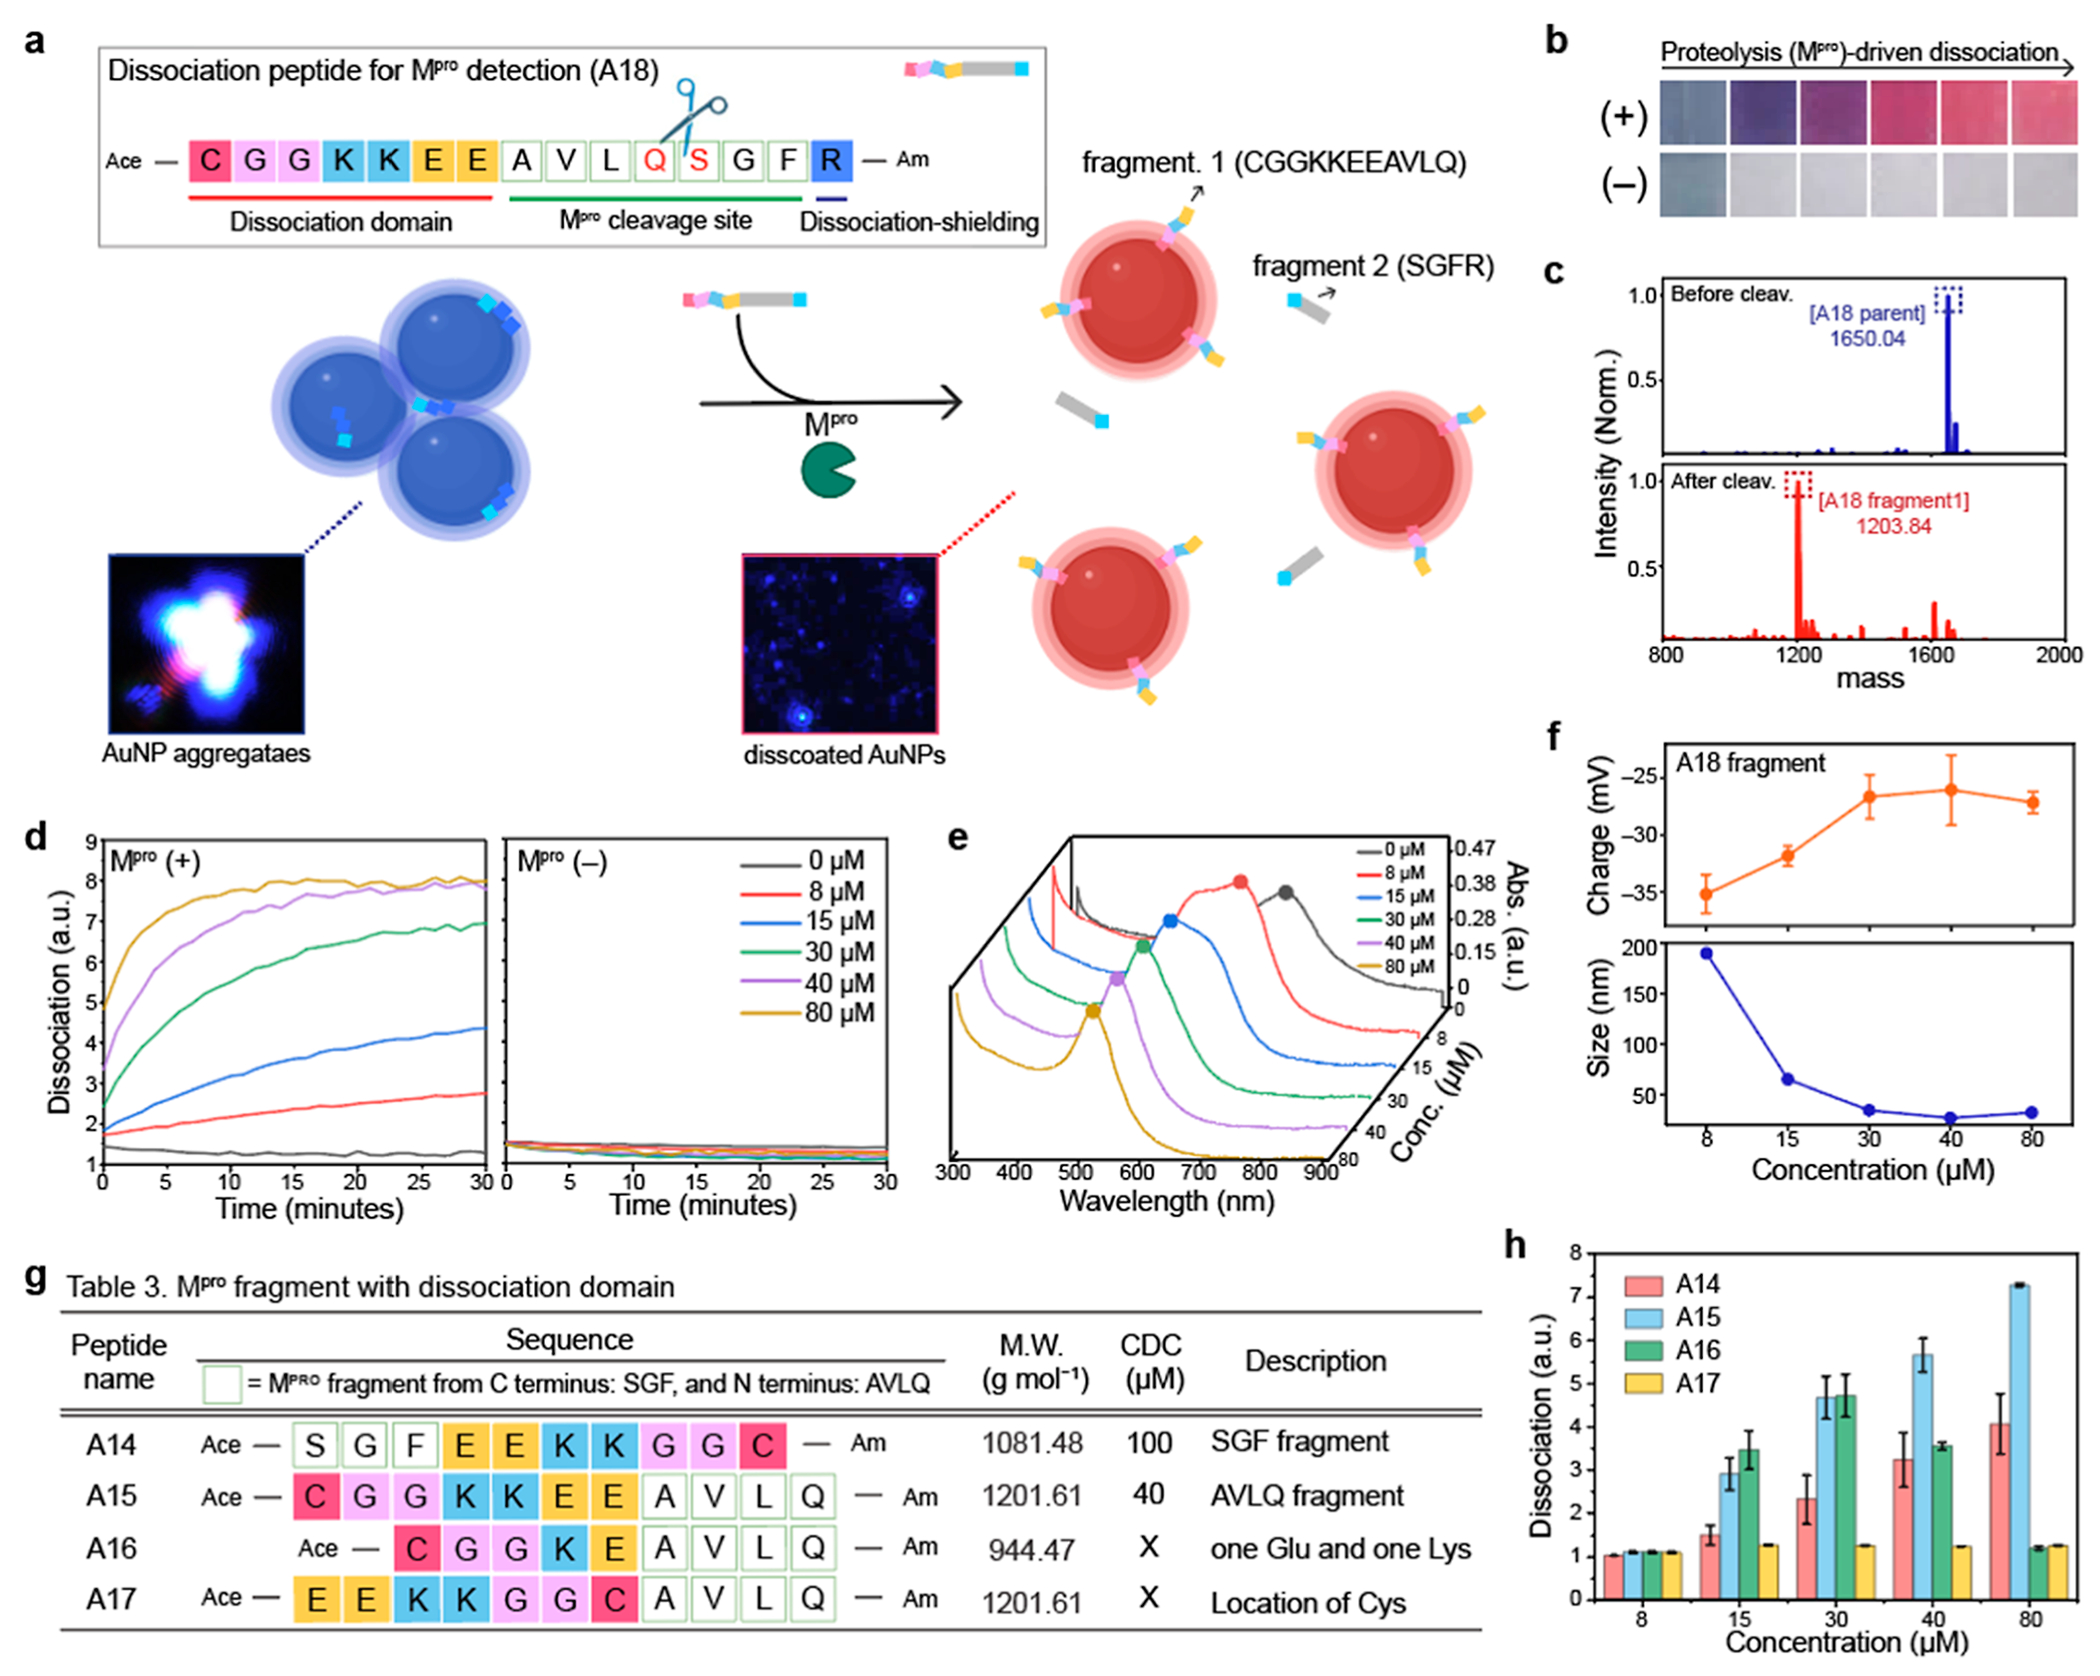
Figure 4.

Mpro detection using dissociation strategy. (a) Schematic illustrates that Mpro cleavage releases dissociation domains, changing the color from blue to red. Our dissociation peptide (i.e., A18) consists of three parts: dissociation domain (CGGKKEE), cleavage site (AVLQ↓.SGF), and dissociation shielding site (R). The inset images are before and after particle dissociation obtained by darkfield microscopy. Blue dots indicate actual AuNP aggregates (left) and the dissociated AuNPs (right). (b) Color changes with (+) and without (−) Mpro in PB buffer. The released A18 fragment (CGGKKEEAVLQ) dissociated AuNP aggregates, changing the color from blue to red. (c) MALDI-TOF MS data before and after Mpro cleavage, confirming the mass peaks of the A18 parent and its fragment. (d) Time-dependent particle dissociation by the A18 fragments. The results showed that at least 40 μM of the A18 fragment was required for particle dissociations. (e) UV–vis spectrum before and after particle dissociation by the A18 fragments with different concentrations (8–80 μM). (f) Changes in the size and surface charge after the dissociation induced by Mpro cleavage. Table 3 in (g) describes peptide sequences that are designed to confirm the best location and order of the dissociation domain for Mpro detection. (h) Particle dissociations driven by the A14, A15, A16, and A17 peptides. The results show that the dissociation domain located at C-terminus showed the highest dissociation capacity. In addition, the thiol group at the tail showed higher dissociation affinity than the thiol group in the middle. The panel (f,h) repeated three independent times and showed similar results.
