Abstract
Recent development in fluorescence-based molecular tools have contributed significantly to developmental studies, including embryogenesis. Many of these tools rely on multiple steps of sample manipulation, so obtaining large sample sizes presents a major challenge as it can be labor intensive and time consuming. However, large sample sizes are required to uncover critical aspects of embryogenesis, for example subtle phenotypic differences or gene expression dynamics. This problem is particularly relevant for single-molecule fluorescence in situ hybridization (smFISH) studies in C. elegans embryogenesis. Microfluidics can help address this issue by allowing large number of samples and parallelization of experiments. However, performing efficient reagent exchange on-chip for large numbers of embryos remains a bottleneck. Here, we present a microfluidic pipeline for large-scale smFISH imaging of C. elegans embryos with minimized labor. We designed embryo traps and engineered a protocol allowing for efficient chemical exchange for hundreds of C. elegans embryos simultaneously. Furthermore, the device design and small footprint optimize imaging throughput by facilitating spatial registration and enabling minimal user input. We conducted the smFISH protocol on-chip and demonstrated that image quality is preserved. With one device replacing the equivalent of ten glass slides of embryos mounted manually, our microfluidic approach greatly increases throughput. Finally, to highlight the capability of our platform to perform longitudinal studies with high temporal resolution, we conducted a temporal analysis of par-1 gene expression in early C. elegans embryos. The method demonstrated here paves the way for systematic high-temporal resolution studies that will benefit large-scale RNAi and drug screens, and in systems beyond C. elegans embryos.
Graphical Abstract
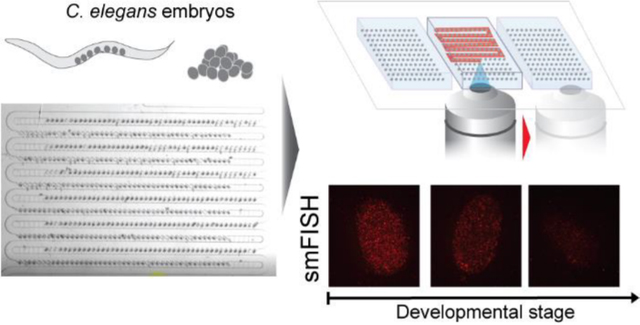
Small genetic model organisms, such as C. elegans and Drosophila melanogaster, have been used to address many questions in organismal development1–3. Technical advancements such as CRISPR, single-molecule fluorescence in situ hybridization (smFISH), and super-resolution microscopy, have contributed significantly to biological discoveries4–9. Many of the readouts of these studies rely on the visualization of cell-biological events using fluorescence-enabled methods, as fluorescent markers can quantitatively report molecular positions and numbers with reasonable precision. The challenge with fluorescence reporters, especially non-genetically encoded reporters, is that they tend to involve many steps of manipulating the specimen to obtain a clear signal, e.g., washing, hybridizing, staining, and blocking. On the other hand, direct staining and hybridizing methods permit the treatment of multiple genotypes, an experimental design often required in evolutionary developmental biology and quantitative genetics. However, such studies typically also require large sample sizes for statistical reasons, and these multi-step experiments do not scale well in terms of manual labor and time involved. As a result, this technical limitation creates a bottleneck in addressing any questions requiring high replication, such as phenotypic differences between wild-type genotypes from a natural population, or dynamic changes in gene expression over developmental time. This hampers the application of tools of developmental genetics to systems biology.
This problem is particularly relevant when using smFISH to study gene expression changes during C. elegans embryogenesis. smFISH is a broadly used technique that allows for counting individual mRNA molecules by targeting a gene of interest using short nucleic acid probes with a fluorescent label10,11. Many smFISH-based techniques have been recently developed to increase the versatility of this approach and make smFISH a powerful tool for studying the spatio-temporal expression of genes12–17. However, smFISH implementation in embryogenesis studies remains difficult. For example, when targeting a specific developmental stage or performing longitudinal studies in C. elegans, rapid cell division makes isolating embryos of a particular stage of interest an inefficient process (Fig. 1A). In addition, tens of individual samples are often required to account for heterogeneity in gene expression, resulting in the need to process hundreds of embryos per experimental condition. Performing such an assay is arduous due to the complexity of smFISH protocols that are time-consuming and labor-intensive. This issue becomes even more exacerbated as the number of experimental conditions increases to study mutants, natural variants, or different treatments. Therefore, an effective platform to broaden the impact of the smFISH method for embryogenesis studies would require single-embryo resolution, capability of assaying hundreds of embryos simultaneously, and parallelization of the protocol. Furthermore, resolving these issues would also enhance many other imaging techniques that require multiple reagent exchange steps.
Figure 1.
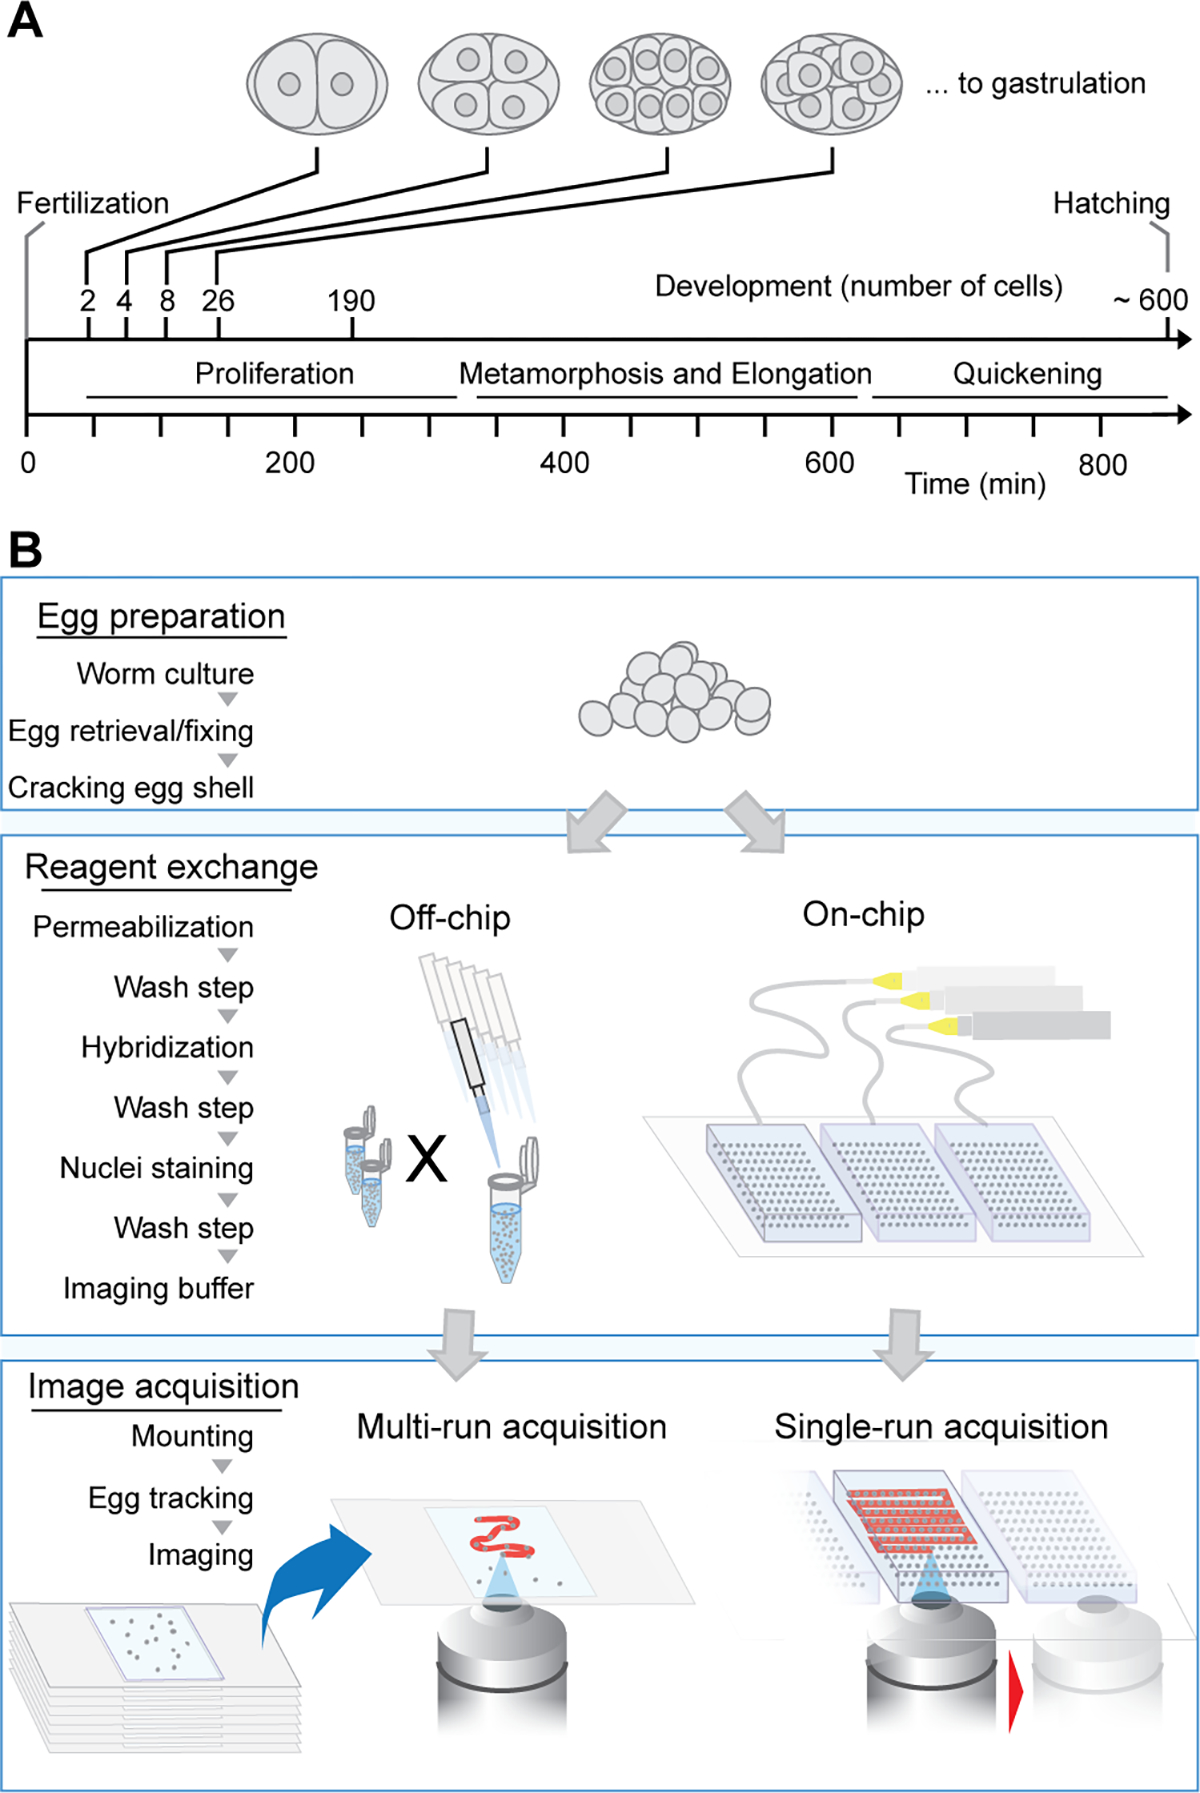
Pipeline for studying gene expression during embryogenesis with high temporal resolution. (A) Timeline of early stage development of C. elegans embryos. (B) Schematic highlighting advantages of our integrated microfluidic pipeline vs traditional off-chip method for smFISH imaging: parallelization of experiments and automated imaging.
Microfluidics has the potential to transform smFISH into a high-throughput technique for C. elegans embryogenesis studies. Previous studies have demonstrated the use of microfluidic devices to array C. elegans embryos18–21. However, these devices have a limited capacity (~100 traps per array) due to low density of traps per area. In addition, these devices are designed specifically for live imaging with no need for reagent exchange. Integrating reagent exchange on chip is non-trivial due to the presence of many flow perturbations during the protocol that can lead to sample movement and sample loss. Since many imaging-based techniques require multiple reagent exchanges, there is an acute need for microfluidic devices for handling a large amount of samples, allowing parallelization, and obtaining complementary information via combining several of these techniques. Establishing a pipeline that allows for efficient reagent exchange without losing embryos remains challenging and would enable a broad range of molecular tools to be applied to developmental systems biology.
Here we present a microfluidic pipeline to address this challenge. We designed embryo traps and established a protocol capable of staining hundreds of C. elegans embryos simultaneously with efficient reagent exchange. We applied this process to a multi-step smFISH protocol. Using smFISH probes targeting the embryonic gene par-1, we show that the on-chip smFISH protocol allows for parallelization of experiments while preserving image quality relative to the traditional slide-based method, thus enabling high-temporal resolution of gene expression during early embryogenesis. Our microfluidics smFISH pipeline is thus a powerful tool for characterizing the dynamics of gene expression changes during embryogenesis.
EXPERIMENTAL SECTION
Microfluidic device fabrication.
The microfluidic device was fabricated using soft lithography22. Briefly, the master was obtained via successive optical lithography steps using SU-8 2015 and SU-8 2025 photoresists (MicroChem) onto a silicon wafer. The channel depths were 12 μm for the backflow channel and 50 μm for the rest of the network. After development in SU-8 developer, the master was treated overnight with tridecafluoro-1,1,2,2-tetrahydrooctyl-1-trichlorosilane vapor (Sigma-Aldrich). A mixture of 10:1 polydimethylsiloxane (PDMS): crosslinker was then poured on top of the wafer to obtain a thickness of ~5 mm and cured in the oven at 70 °C for 48 hours. Then, blocks of PDMS were cut, access wells punched, and the PDMS blocks were bonded to coverslips via plasma treatment. Scaling up via multi-array integration was achieved by bonding several devices on the same glass slide.
C. elegans maintenance and reagents.
N2 strain nematodes were grown on NGM agar plates with OP50 E. coli lawns at 20 °C. Bleaching solution, M9 buffer solutions were prepared as previously described23; surfactant tween 20 (Sigma-Aldrich) was mixed in M9 solution at 0.03 % (w/w). The fixation buffer was composed of 5 mL 37% formaldehyde (Sigma-Aldrich) and 45 mL nuclease-free PBS 1x (Corning). Ethanol was mixed in deionized water at 70 %. DAPI staining solution was used to stain chromosomes and identify cell nuclei. Custom-made dry smFISH probes (Stellaris) targeting par-1 labeled with Quasar 670 were dissolved in TE buffer (10 mM Tris-HCl, 1 mM EDTA, pH 8.0). Final hybridization buffer is composed of 1g dextran sulfate, 1 mL 20X saline-sodium citrate (SSC), nuclease-free, 1 mL deionized formamide, 8 mL nuclease-free water and contains 1.25 μM of the smFISH probe.
Wash buffer was made from 10 % formamide, 2× SSC, in nuclease-free water. Prior to imaging, embryos were prepared with GLOX antifade buffer (850 μL nuclease-free water, 40 μL 10 % glucose in water, 10 μL 1 M Tris-HCl, pH 8.0, 100 μL 20X SSC), followed by GLOX buffer with enzymes. The solution of GLOX buffer with enzymes was obtained using 100 μL of GLOX buffer and 1 μL of catalase solution and 1 μL of glucose oxidase solution. The catalase solution is composed of Catalase from Aspergillus niger at ≥4000 units/mg protein in ammonium sulfate suspension (Sigma-Aldrich, C3515). The glucose oxidase solution is composed of Glucose Oxidase from Aspergillus niger (Sigma-Aldrich, G2133) at 3.7 mg/mL in 50 mM sodium acetate solution. For the flow-visualization experiments, fluorescein isothiocyanate (FITC)-dextran was dissolved in hybridization buffer at 1 mg/mL.
smFISH protocol on chip.
Embryos were obtained by bleaching gravid-adult animals,23 and immediately transferred into microcentrifuge tubes filled with 1 mL fixation buffer. After 15 min on a rotary shaker, the tubes were submerged in liquid nitrogen for 2 min to freeze crack the embryo shells, then thawed in running water, and placed on ice for 20 min. The resulting pellet was washed and resuspended in M9 solution with surfactant at roughly 10,000 embryos per mL. The embryos were then manually loaded in the device using a syringe. All subsequent reagents were delivered from the side inlet of the device via a syringe. For every reagent change, the inlet tubing is clipped before releasing pressure of the syringe. Then a new syringe containing the next reagent is connected. Finally, gentle positive pressure is applied on the new syringe while the inlet tubing is unclipped. The devices were continuously perfused with 70 % ethanol overnight at 4 °C using a flow rate of 125 μL.hr−1.
The on-chip smFISH protocol was developed from previously published techniques for C. elegans embryos10,11. All wash steps were conducted at 900 μL.hr−1 while incubation steps were conducted by flowing at 500 μL.hr−1 for 10 min every 30–60 min. Following the overnight permeabilization in 70 % EtOH, the embryos were washed in wash buffer for 10 min before incubation in hybridization buffer at 37 °C for 4 hr. Next, the embryos were washed with wash buffer for 30 min and stained with DAPI for 45 min. The hybridization, wash and DAPI staining steps were conducted in the dark. Finally, the samples were washed with wash buffer, 2x SSC, then GLOX antifade buffer followed by GLOX buffer containing enzymes before proceeding to imaging.
smFISH protocol off chip.
The same reagents were used for on- and off-chip experiments. The embryo preparation up to freeze-cracking was identical to the on-chip protocol. Afterwards, the embryos in the microcentrifuge tube were resuspended in 70% ethanol and rotated overnight at 4°C. Reagent exchange off-chip was carried out by spinning down the embryos for 30 s using a centrifuge, removing the supernatant and resuspending the embryos in a new reagent. Embryos were mounted on glass coverslips and using Glox antifade buffer.
Fluorescence microscopy and signal quantification.
All smFISH images were obtained using a spinning disk confocal microscope (PerkinElmer UltraVIEW VoX) equipped with a Hamamatsu C9100–23b back-thinned EM-CCD and a 100× oil immersion objective. The smFISH images were analyzed using FISH-quant software to identify and count the punctae24. To enable accurate comparisons between on-chip and off-chip samples, we matched the age of the embryos and the sample size for each experiment. SNR and SBR are calculated using a custom MATLAB code. Briefly, after masking the embryo area, 2-gaussian fit modeling was applied to the pixel intensity distribution to identify the background and punctae. The mean of the “punctae” gaussian was used to threshold the embryo image and split the image into a background-only image and a punctae-only image. The peak amplitudes of all distinct areas of the punctae image were averaged to obtain the signal amplitude A. The background image was processed to obtain its mean, B and standard deviation, N to characterize the background level and noise. SNR and SBR were quantified using the equations SNR = (A-B)/N and SBR = A/B.
For the flow-visualization experiments, we flowed the FITC dye solution from the side inlet at a flow rate of ~500 μL.hr−1 on a dissecting scope (Leica, MZ16F). We quantified the dynamics of fluorescence intensity in the microchannels using a custom MATLAB code.
EXPERIMENTAL DESIGN
We aimed to create a pipeline that considerably increases the throughput of smFISH, to maximize sample size and thus improve the temporal resolution of gene expression during embryonic development. smFISH protocols are complex; they include sample collection, fixation, membrane permeabilization, staining, and mounting for imaging. Altogether, ten steps are necessary to treat the embryos and prepare them for imaging in traditional smFISH. Figure 1B shows an overview of our method in parallel to the off-chip protocol to highlight some of the advantages of our pipeline. Using a microfluidic device enables the arraying of hundreds of embryos while allowing for reagent exchange necessary to the execution of the smFISH protocol. The on-chip pipeline allows for increasing throughput during imaging. Using a high-density array for embryo ordering and trapping, we minimize the painstaking task of preparing numerous single glass slides and circumvent the need for a user to set up each glass slide one after the other during the imaging session. Using our microfluidic approach, image acquisition can be performed in one run with minimal input from the user.
RESULTS AND DISCUSSION
Designing platform for large-scale arraying and smFISH analysis of C. elegans embryos.
To study gene expression during embryogenesis requires assaying embryos at specific developmental stages. Precise monitoring of developmental stage is important as gene expression can vary rapidly. However, achieving temporal resolution is difficult, because developmental stages can only be determined post-analysis and hundreds of embryos may need to be processed to capture the desired stages. Indeed, cell divisions in early embryogenesis, up to gastrulation, occur every few minutes after fertilization and take place before the embryos are normally laid outside the body; the zygote then transforms into a 300-cell embryo within 300 min and hatches into a nearly 600-cell larva within 850 min25 (Fig. 1A). The rapid development process makes data acquisition challenging, particularly for early embryonic stages. Assuming a 5–10 % efficiency to collect embryos of a given stage and the need for a few tens data points to capture gene expression variation, establishing representative gene expression in early embryogenesis requires collecting approximately 300–500 embryos. To arrange such a large number of embryos on a single glass slide is a challenging task because the embryos must remain separated to ensure quality readout. Performing this step in a time-effective manner is important too. The whole smFISH protocol requires several days, one wants to complete this preparatory step within a few minutes to minimize labor. However, such requirement adds significantly to the difficulty of the task. To address this bottleneck, we designed a microfluidic array for capturing hundreds of C. elegans embryos. The system relies on hydrodynamic trapping, where embryos flowing through a main channel are drawn into bypass traps26–31. This design turns loading of the array into a deterministic process. As embryos flow in the channel, the embryos are drawn to the first available traps. Once trapped, the embryos obstruct the back-resistance channels, changing the flow streamline in the main serpentine channel. Therefore, next coming embryos are drawn to the next available traps and this process repeats itself until complete filling of the array. This design allows for arraying embryos in high density and takes advantage of passive trapping to efficiently isolate single embryos from a bulk suspension (Fig. 2A). To adapt this technology for large-scale phenotyping of gene expression using smFISH, several key aspects of the device design needed to be improved.
Figure 2.
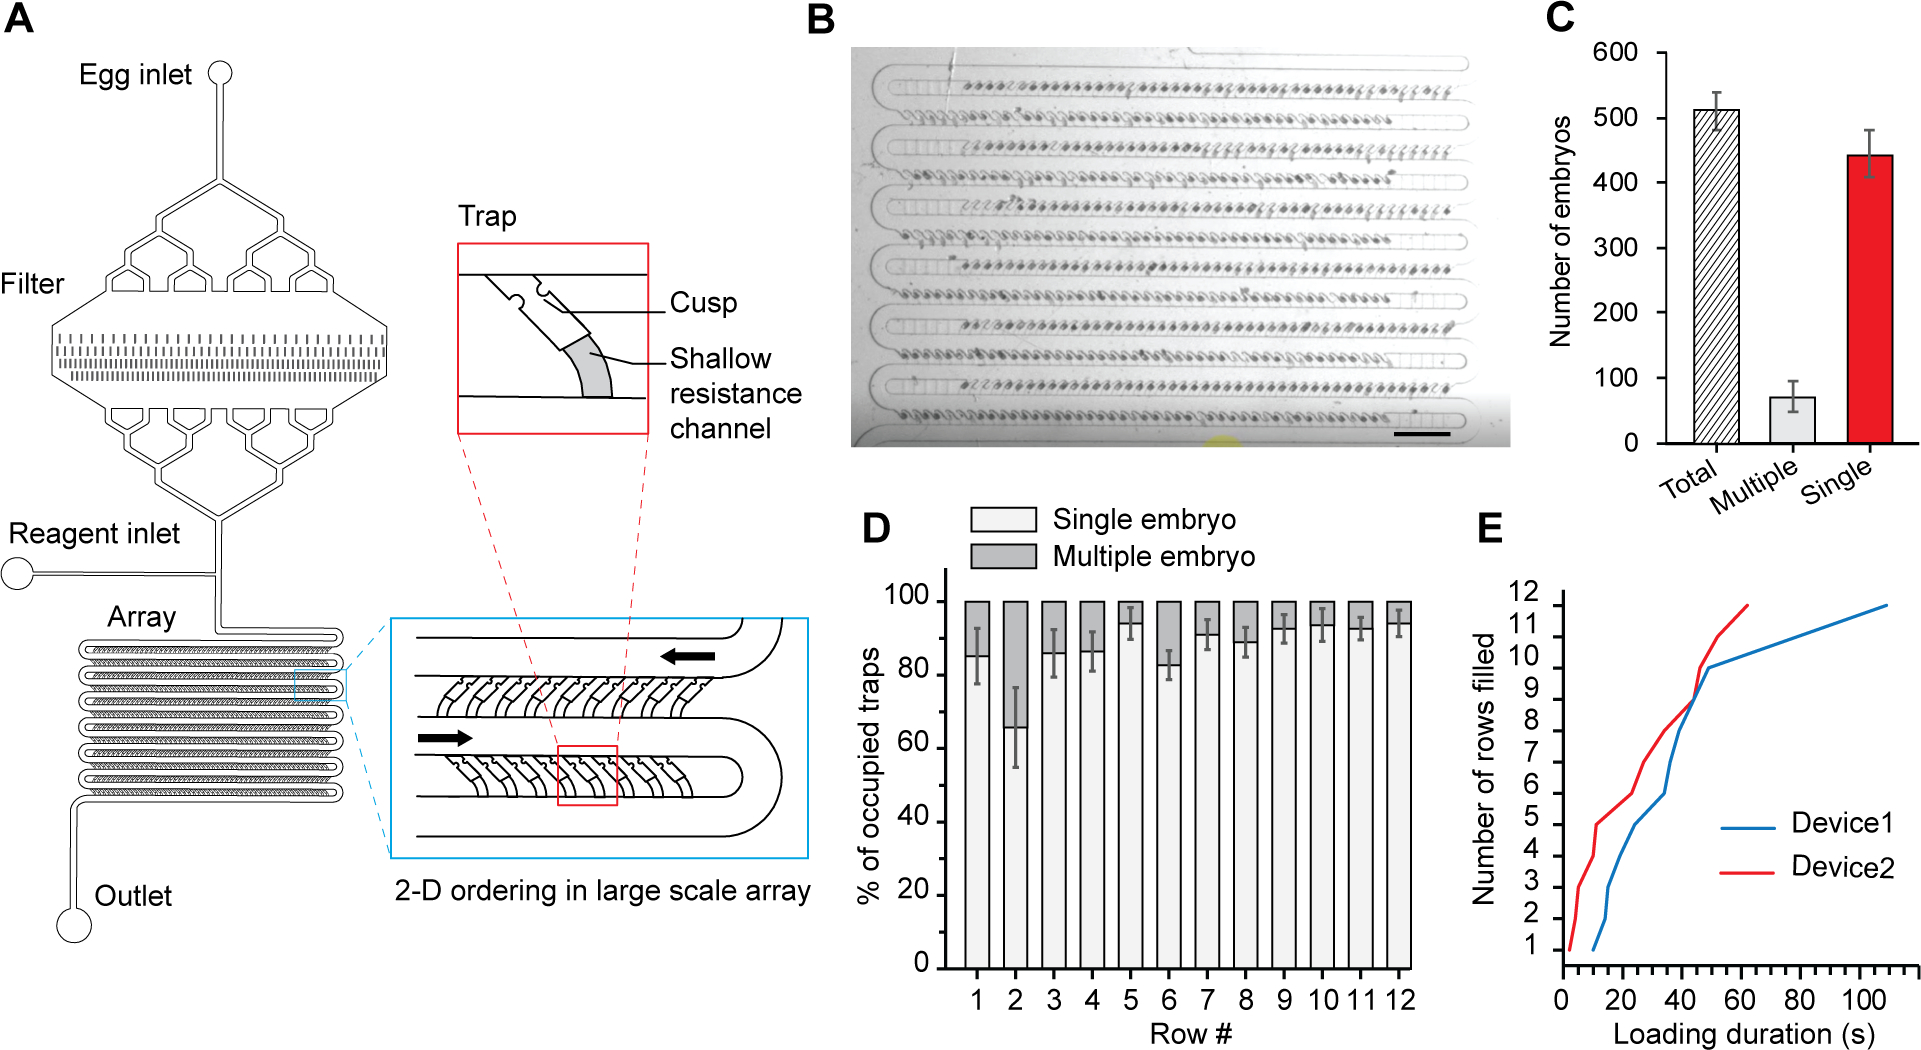
Microfluidic device design and loading characterization. (A) Schematic illustrating the device design and features incorporated to enable robust and reproducible hydrodynamic loading of hundreds of eggs (total trap number: 600) with Insert detailing the relevant geometrical dimensions; main channel (100 μm), trap size (35 μm) and resistance channel (12 μm). (B) Image of microfluidic array showing single embryos loaded in device in AP direction. (C) Quantification of loading occupancy in device. (D) Homogeneity of egg loading throughout the array (c-d: n=4 devices) Error bars represent SD. (E) Loading duration across 2 different devices.
To allow for large-scale parallel mRNA counting with single-embryo resolution, we designed our microfluidic chip with several features specific to the smFISH application. First, to enable reagent delivery to all traps requires a clear flow path throughout the entire device. This is important as smFISH protocol involves multiple steps with different reagents. The challenge lies in how best to avoid embryos from clogging the channel because of their stickiness and natural tendency to clump together. Hence, to address this issue, we included an in-line filter and a second side inlet downstream the filter for reagent delivery. Upon embryo loading, the in-line filter reduces the number of embryo aggregates that reaches the array. Once loading is complete, the inclusion of the side inlet allows for injecting new reagents without pushing embryo aggregates trapped in the filter into the array (Fig. 2A). Second, because we are interested in quantifying smFISH signals throughout the entire embryo sample, maximizing the imageable volume is important. Hence, we designed the traps to have the anterior-posterior (AP) axis horizontal; thus, ensuring that the z-direction depth only needs to be 30 μm and minimizing optical artifacts due to light scattering from the embryo tissue.
We demonstrate efficient loading of hundreds of embryos in A-P orientation and with a cleared main channel. Figure 2B shows an image of an array loaded with single embryos in A-P axial orientation. Quantification of the loading occupancy across 4 devices shows reliable capture of more than 500 embryos per array (Fig. 2C) and homogenous distribution across the array (Fig. 2D). Multiloading events were almost exclusively composed of n = 2 embryos. We observe less than 10 % of empty traps. Small debris are likely clogging the back-resistance channels of these traps, rendering them unavailable for embryos. Additional washing steps and or use of gentler mechanical agitation and lower centrifugation speed during the egg preparation may help avoiding debris and reducing the number of empty traps. In addition, the loading process is achieved within a couple of minutes: all 12 rows of the device are loaded in less than 2 minutes (Fig. 2E, Supp. video 1). The quick loading minimizes the amount of time the samples are exposed to formaldehyde, which can increase background fluorescence in the smFISH images. Altogether, these results demonstrate the ability of our microfluidic platform to capture hundreds of single embryos for downstream analysis.
Microfluidic platform enables efficient reagent exchange necessary for executing smFISH protocol.
To execute smFISH protocol reproducibly on-chip requires efficient reagent exchange. The smFISH protocol is a multi-step process that involves several reagents, different concentrations, temperature changes, and incubation times. Proper execution of each step is important for obtaining quality smFISH images. However, while most of these parameters can be optimized by controlling external conditions, reagent delivery is achieved locally on-chip and is particularly sensitive. For example, delays in bringing the smFISH probe into and out of contact with embryo can lead to lower probe concentration or over exposure resulting in lower smFISH signal, uneven staining, and high background fluorescence32,33. Reagent exchange is challenging because it requires delivering chemicals to the embryo without losing the embryo in the process. To solve this problem, we added two design considerations to address sample loss from the trap entrance or the back channel. First, when moving the device from the cold room to the incubator or microscopy room, movement of the inlet and outlet tubing can generate fluctuations of pressure through the array and generate back flow. The back pressure can push the embryo through the trap entrance in the main channel. This may result in sample loss when flow is re-applied during the multistep protocol. To prevent that, we included a cusp at the trap entrance. The local narrowing of the channel maintains the embryo inside the trap.
Second, flow rates and viscous liquids (hybridization buffer viscosity is several tens of cP) induce shear forces that can push the embryo in or through the resistance channel. To solve this issue, we designed and compared the performances of three resistance channel geometries (Fig. 3A and SI Fig.1). The first design is a single 12×26 μm2 (width x height) channel. We hypothesized that creating a step-down (main channel height = 50 μm) would reinforce trapping efficiency. The second design is composed of two 13×12 μm2 channels. Splitting the backflow channel may help with avoiding flow obstruction by the embryo and favor reagent exchange. The third design is similar to the first one but flipped into a single 26×12 μm2 channel. This design reinforces the step-down effect. Despite their different geometry, all three designs have similar hydraulic resistance and lead to efficient embryo loading. However, we noticed undesirable effects for the two first designs. The first design failed to keep the embryo in the trap as the embryo fully blocks flow and the pressure differential across the embryo pushes it partially or completely into the resistance channel. The second design prevents this issue as an embryo blocks only one of the two channels; however, the embryos were frequently morphologically distorted between the two resistance channels. Finally, the third design successfully achieves our goal. The shallow but wide resistance channel helps to prevent the embryo from entering the resistance channel while preserving its integrity, resulting in a low percentage of embryos being pushed in the resistance channel (< 5%). Therefore, we selected this design for further characterization.
Figure 3.
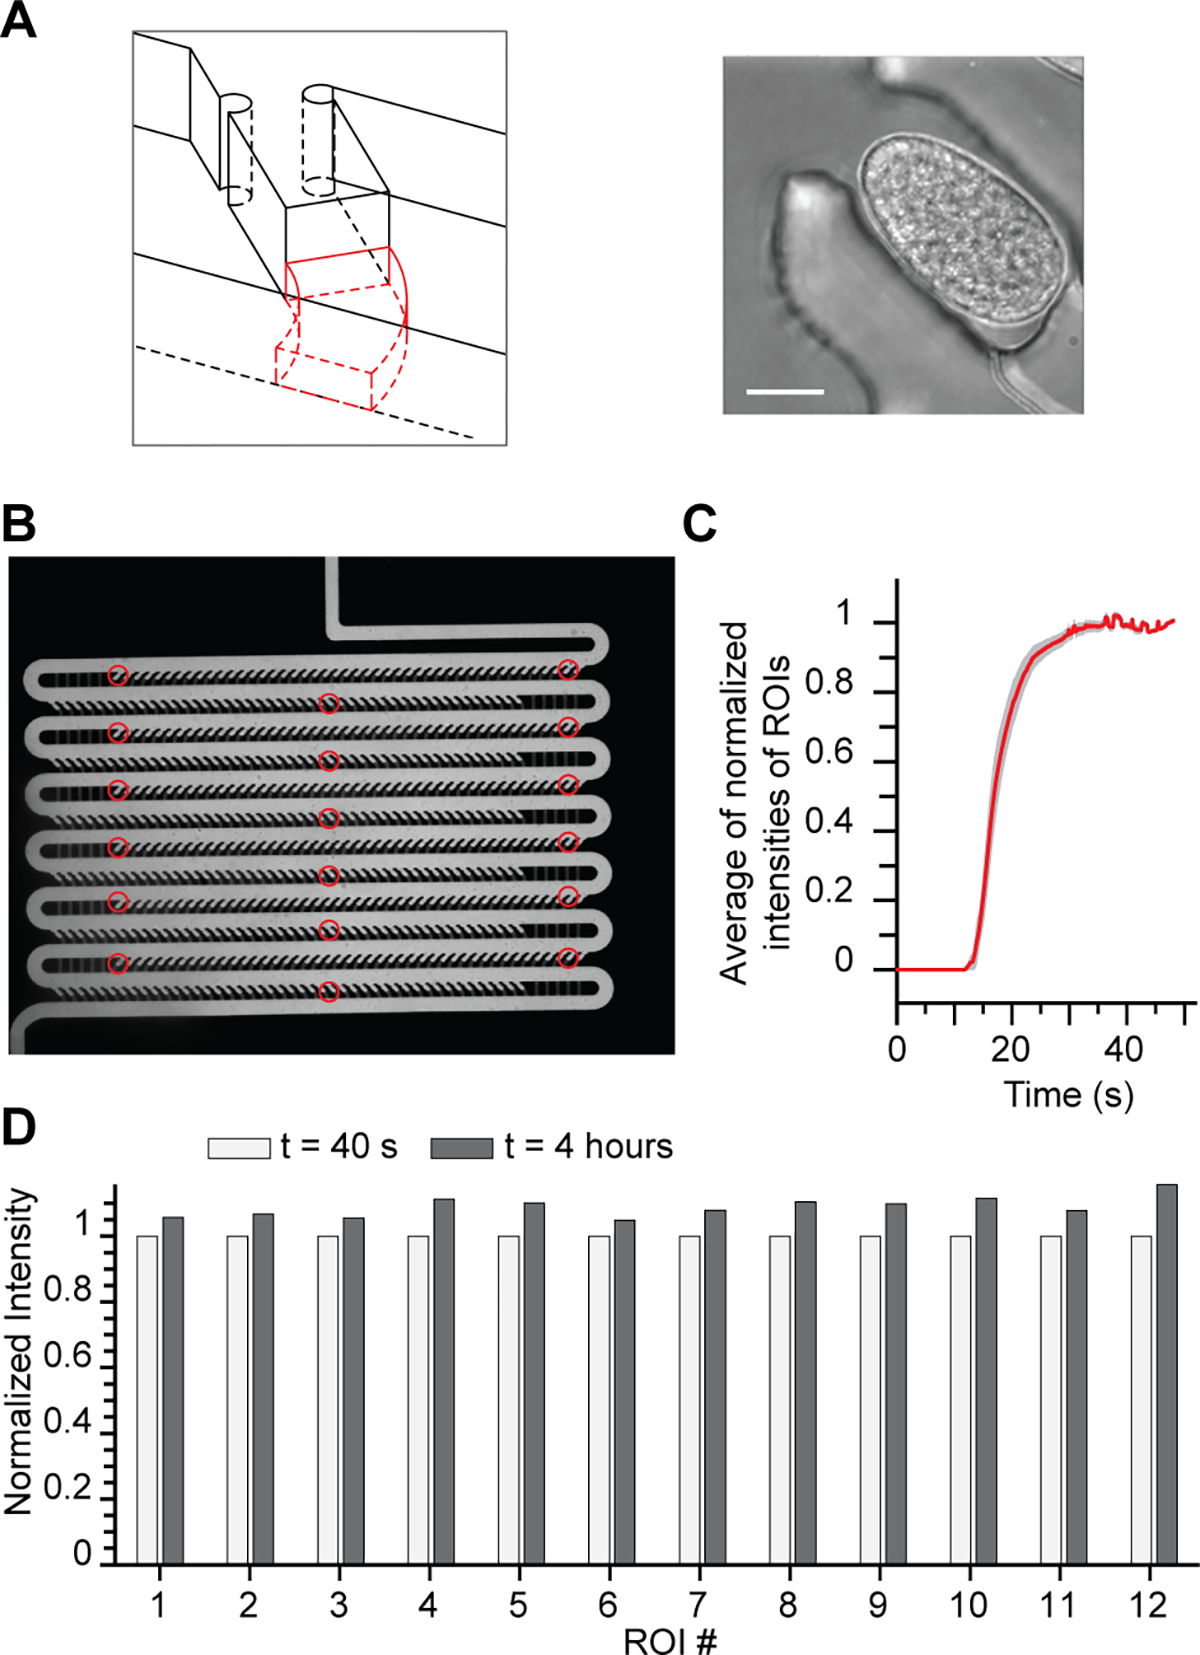
Device features enable efficient reagent exchange necessary for executing smFISH protocol. (A) Schematic of resistance channel geometry designed to maintain embryo positioning during smFISH protocol (left). Representative image of embryo trapped using the resistance channel geometry (right, scalebar: 15 μm). (B) Image of device filled with FITC-dextran. ROIs analyzed are indicated by the red circles. (C) Plot describing the transition regimes for different ROI throughout the array: delivery reaches rapidly permanent regime after 30 seconds. Device was filled with wash buffer and exchanged with FITC-dextran in hybridization buffer to mimic the hybridization step of the smFISH experiment. (D) Bar graph of average fluorescence intensity of the different ROIs in the device at the beginning (40 s) and end (4 hr) of the mock hybridization experiment.
To ensure the device can exchange reagents efficiently without losing embryos, we studied the delivery of reagents in a fully loaded array device using fluorescein isothiocyanate (FITC)-dextran in hybridization buffer as a model for the smFISH probes. We measured FITC-dextran intensity at different locations in the device (Fig. 3B), and showed that the fluorescence intensity increases over time and stabilizes in the device after roughly 30 s (Fig. 3C), which is negligible compared to the duration of each steps (30 min to several hours). To verify that reagent delivery is uniform over time, we compared the fluorescence intensity at the beginning of the assay (once the stable regime is reached) and 4 hr later (~ duration of probe hybridization step). Figure 3D shows that the measured FITC-dextran intensity in the device at the beginning of the experiment is close to the intensity at the end of the experiment and that these results are verified through the entire device. The small difference between the two timepoints can be explained by variation in intensity of illumination. In summary, our on-chip protocol ensures efficient liquid exchange, which is essential for the proper execution of the complex multistep smFISH protocol.
On-chip smFISH staining preserves image quality of conventional techniques.
To check potential degradation in image quality that may arise from absorption of reagents in PDMS, or optical artefact from PDMS walls, we compared smFISH assays performed in parallel on-chip and off-chip. Figure 4A shows representative fluorescence images. The embryos were hybridized with probes targeting mRNA transcripts of par-1, a kinase essential in early embryogenesis34,35; each spot indicates a single mRNA molecule and the total number of punctae per embryo represents par-1 transcript abundance. The presence of PDMS does not induce any artefact and the overall image quality is preserved: we observe homogenous signal throughout the embryo and clear presence of punctae, typical of smFISH signal11. We quantified the signal-over-noise ratios (SNR) to determine if the SNR of on-chip images is greater than 7, which is a requirement for smFISH image quantification as previously described24. The images of on-chip embryos have a SNR of nearly 9 and the images of off-chip embryos have a SNR of 10 (Fig. 4B). The slight difference between the two images may be reflective of lower intensity in the on-chip images as highlighted by the difference in signal-over-background ratios (SBR) between the two methods (Fig. 4C). Nonetheless, the SBR values are much greater than 1 and the SNR values are all above 7. Therefore, our method preserves the image quality necessary for performing valuable smFISH analysis.
Figure 4.
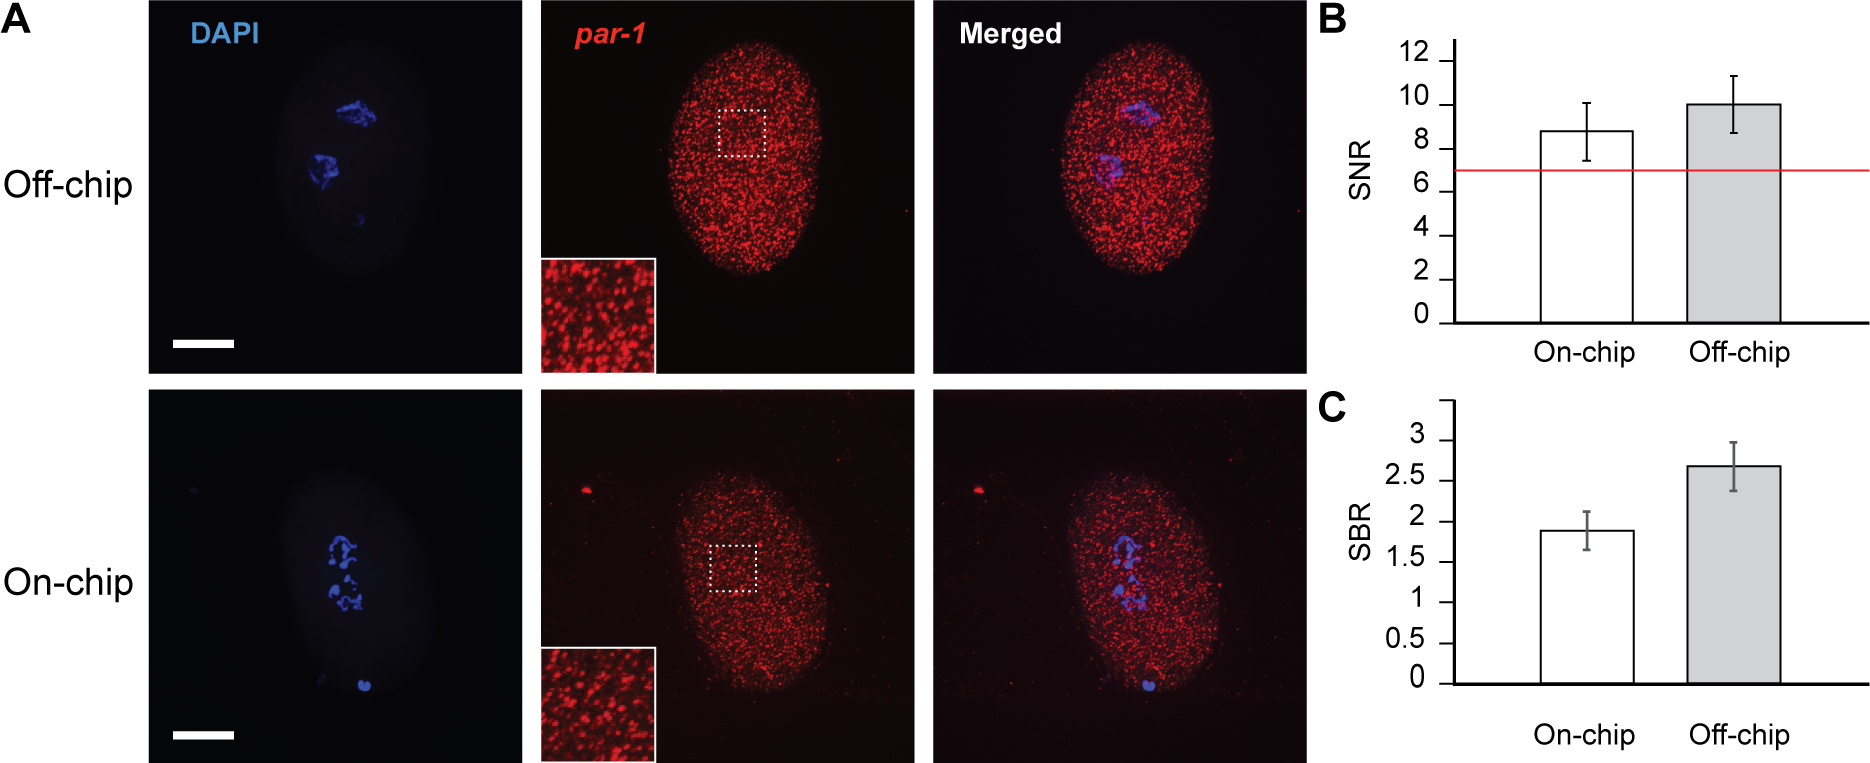
Comparison of on-chip smFISH protocol with traditional off-chip method. (A) Representative images of eggs stained off-chip (top) and on-chip (bottom) with the smFISH protocol. Blue indicates DAPI and identifies nuclei by staining chromosomes. Red puncta indicate individual par-1 molecules with zoom-in views in inserts. Scale bars are 15 μm. (B-C) Quantification of image quality between off-chip and on-chip experiments using SNR and SBR of the puncta for each condition. The red line indicates the minimum acceptable SNR for smFISH quantification (SNR = 7). Error bars represent SD, n = 20 embryos.
Scaling up via multi-array integration.
To study multiple conditions, it is necessary to scale up the device. For example, studies comparing different RNAi treatments or genotypes (natural variants or mutants) require batches of embryos to be assayed separately, but otherwise identically. To do so, we integrated three devices and acquired smFISH images in a single session. Figure 5A shows representative images of par-1 gene expression in embryos for each of the three devices. The images show similar and uniform quality across the embryos. We also calculated the signal-over-noise ratio to quantify signal quality and observe that the SNR values across the different devices are all over 7 and meet quality requirement for automated software analysis (Fig. 5B).
Figure 5.
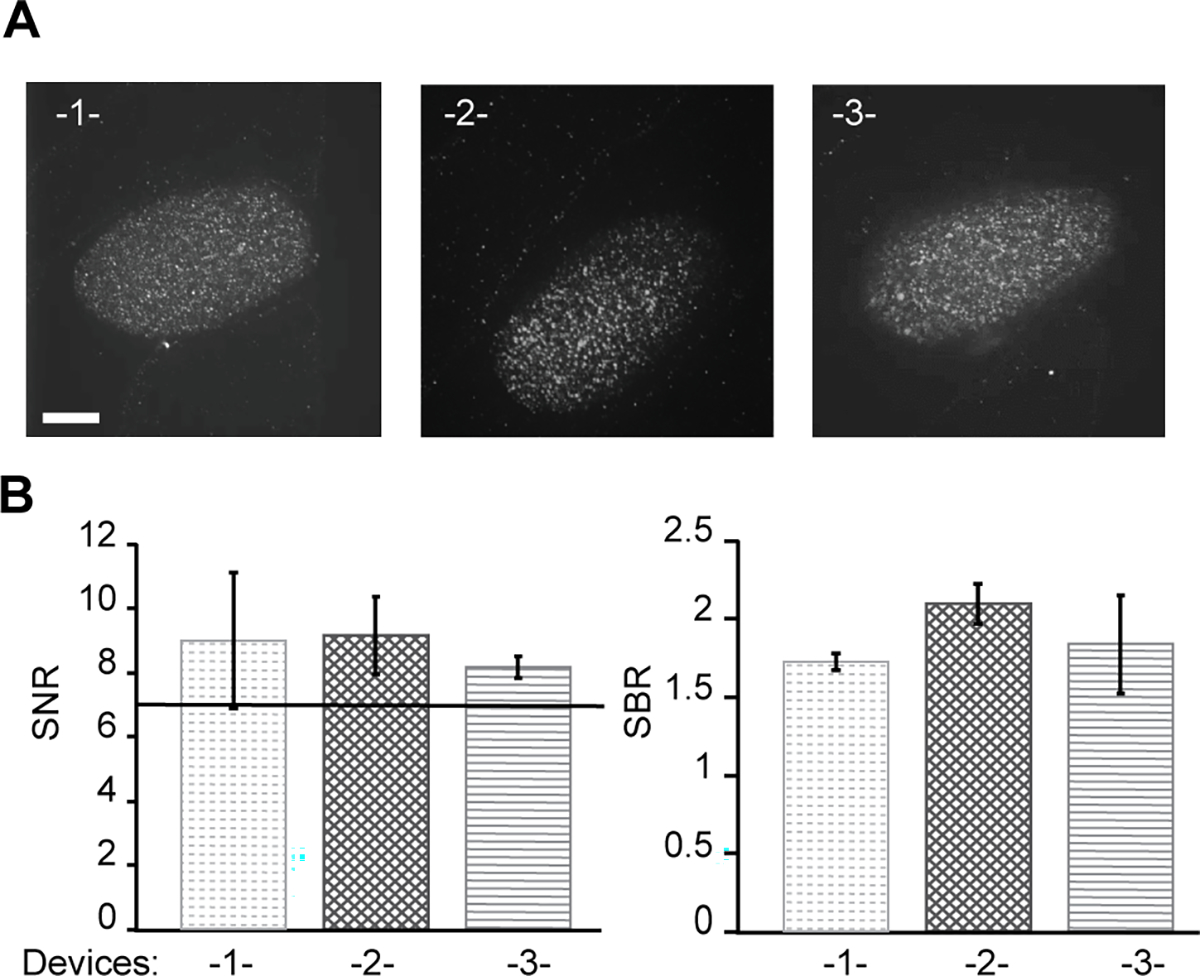
Integration of multiple arrays on single substrate for high-throughput confocal imaging. (A) Representative smFISH images of embryos from each device. Red puncta indicate individual par-1 molecules. Scale bar is 15 μm. (B) Quantification of image quality using SNR and SBR of puncta in each separate device. Error bars represent SD, n = 20 embryos.
These results also illustrate another critical advantage of our method, which is time saved during image capture. Imaging with the traditional method remains time-consuming and labor-intensive because it requires tracking each embryo manually in bright field to register their position. Two bottlenecks render this process painstaking and inefficient. First, spotting embryos randomly spread on a large surface in the absence of any spatial marker is difficult. Second, throughput is limited by how many embryos are present on a single substrate. As one batch is processed, user input is necessary to remove the glass slide and mount another one on the microscope stage before repeating the process. Our microfluidic approach significantly improves these two bottlenecks. Arraying provides with a spatial frame to navigate through the samples and register their position. Furthermore, the small footprint of a single array allows for the integration of multiple arrays on a single glass slide. Therefore, the embryo-position registration can be done at once; the continuous presence of an operator is no more mandatory to image hundreds of samples. For example, using a traditional approach would require imaging 30 coverslips to image 60 embryos of a developmental stage. With our microfluidics-based approach, this type of analysis would require only 3 devices saving time and labor. Scaling up via multi-array integration does not compromise experimental integrity, affording a dramatic increase in sample size and image efficiency while eliminating potential batch effects across treatments. This benefit could be exploited further, limited only by the number of devices that can be arranged on a slide.
Highly resolved temporal analysis of gene expression using microfluidic platform.
Obtaining a detailed temporal analysis of the RNA levels in an organism is key to understanding the effect of its genotype on its traits and behaviour36. This knowledge will not only provide information about gene expression dynamics in tissues of interest, but also provide insight on gene interactions that occur throughout the organism’s life cycle37. To demonstrate the ability to assay embryos across developmental stages at high temporal resolution, we freeze-cracked, arrayed, and stained embryos on-chip with the nuclei stain DAPI. In addition, using the par-1 gene as a case study, we demonstrate that the platform can provide information on the dynamics of gene expression during embryogenesis. par-1 plays a key role in asymmetric division during early developmental events38–40. Therefore, we imaged and quantified gene expression of developmental stages ranging from just before the first cleavage (2-cell stage) to the beginning of gastrulation (30-cell stage).
We observe a decline in par-1 gene expression between early developmental stages and later time points (Fig. 6). This observation is consistent with the known essential activity of PAR-1 during embryonic polarization34,35 as well as observations of declining par-1 transcripts at later stages41. This observation is also consistent with our own measurements using the traditional off-chip method (SI Fig. 2). With a similar trend to our on-chip samples, the number of par-1 gene transcripts declined from 4,000 transcripts at the 2–4 cell stage to 1500 transcripts at 30 cell stage. Altogether, these results highlight the performance and utility of our platform to advance biological studies requiring longitudinal data about gene expression at a high temporal resolution. It is interesting to note that, during the embryo collecting process, embryos as old as mid-gastrulation (~150-cell stage) were also collected (but not analyzed). Since embryos do not change size during development, our device can be used to perform longitudinal studies of gene expression at later stages during the proliferation, metamorphosis, elongation and quickening phases.
Figure 6.
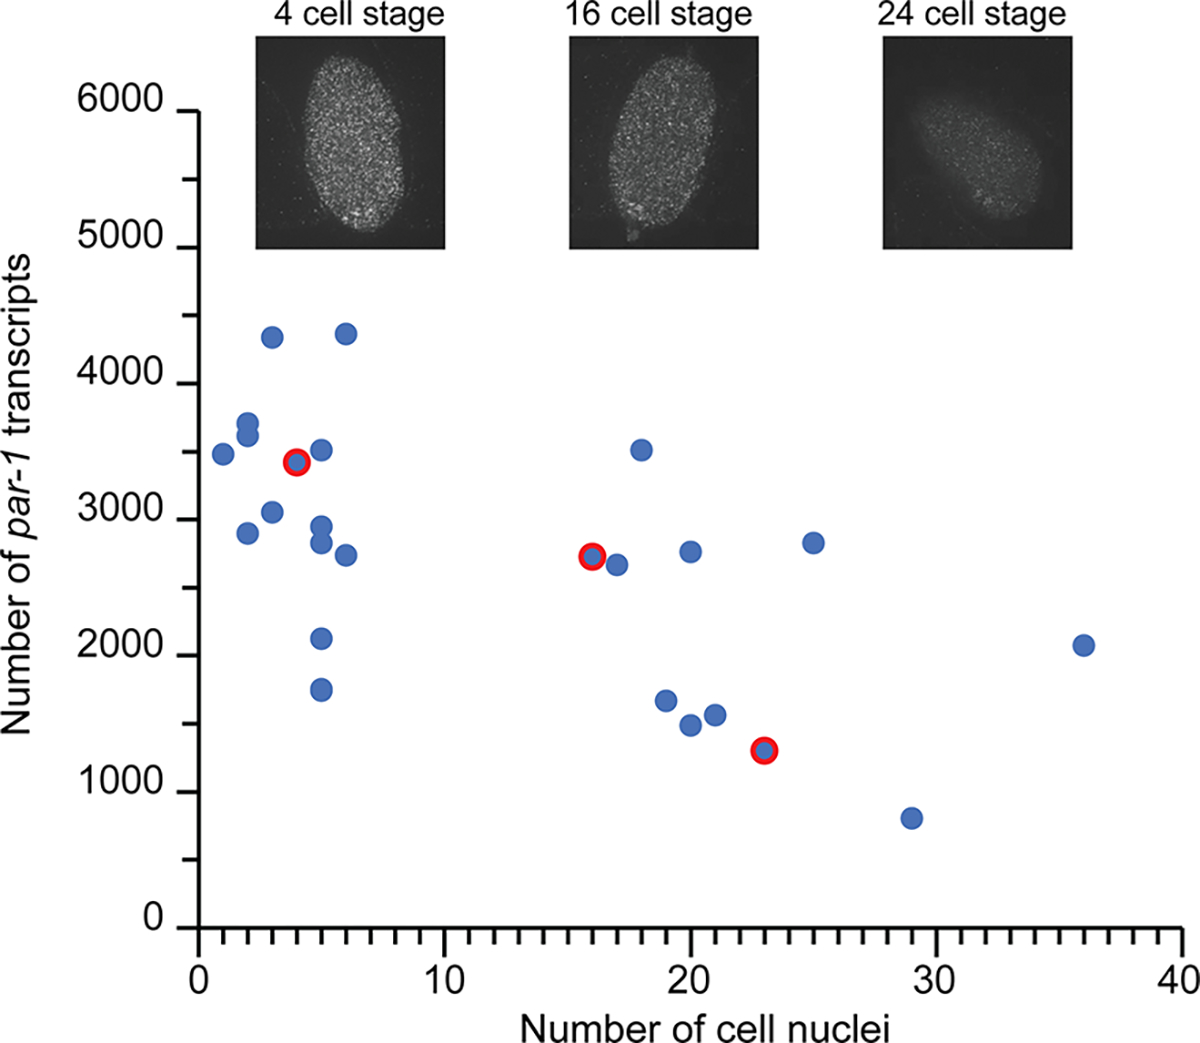
Time-resolved analysis of par-1 gene expression changes during early embryogenesis showing the transcript count versus number of cell nuclei (n = 25 embryos). Inserts show representative smFISH images of embryos at different developmental stages corresponding to the red-circled data points.
CONCLUSIONS
In this study, we report the development of a microfluidics-based smFISH method, which we use to demonstrate changing gene expression in C. elegans embryogenesis at high temporal resolution. We designed a large-capacity, high-density array that can load hundreds of embryos in a few tens of seconds. By trapping large numbers of embryos, this method enables study designs that require large sample sizes, for example assays of changing gene expression across developmental stages. The trap geometry promotes efficient reagent exchange, which allows wash, hybridization, staining, and related steps to be performed on-chip. Finally, the small device footprint allows for multi-array integration that facilitates image acquisition and allows for the application of our platform to larger scale studies. Our approach for reagent delivery and exchange not only reduces the labor-intensiveness of the smFISH protocol but also allows for the integration of alternative or additional assays, such as immunostaining. Further, because the design principles used are not specific to the exact dimensions of C. elegans embryos, simple scaling should allow our approach to be adapted for other problems, including development and pathogenesis in Drosophila or other small genetic model organisms, cancer spheroids, stem cell aggregates, or organoids.
In modern biology, limits to experimental or statistical power often constrain elucidation of the molecular and cellular dynamics that govern development, or the relationship between genotype and phenotype. For example, just as large sample sizes are required to measure change across developmental time, high replication is often required to detect differences in trait expression between multiple genotypes. By enabling loading, staining, washing, and other reagent exchange steps for hundreds of embryos, and by minimizing user effort during image capture, this method offers a generalizable way to scale up the use of molecular tools routinely used in developmental genetics research in order to address larger questions at the level of the biological system.
Supplementary Material
ACKNOWLEDGMENT
The authors acknowledge funding from National Institutes of Health, National Science Foundation, Simons Foundation, and Marcus Foundation (NIH R01NS115484, R01AG056436, R01NS096581, R01GM088333, NSF 1764406, 1707401, and 0939511, Simons Foundation, Marcus Center for Therapeutic Cell Characterization and Manufacturing grants to HL, NIH R35 GM119744 to ABP, NIH R21NS117066 to HL and GA). The authors also thank A. Lifland for technical assistance and Drs. G. Sun, M. Crane, and D. Patel for inputs on the manuscript.
Footnotes
The authors declare no conflict of interest.
REFERENCES
- (1).Wood WB The Nematode Caenorhabditis Elegans; Cold Spring Harbor Laboratory: New York, 1988. [Google Scholar]
- (2).Bryson-Richardson R; Berger S; Currie P Atlas of Zebrafish Development; Academic Press: San Diego, 2012. [Google Scholar]
- (3).Bate M; Martinez Arias A The Development of Drosophila melanogaster; Cold Spring Harbor Laboratory: New York, 1993. [Google Scholar]
- (4).Raj A; Rifkin SA; Andersen E; van Oudenaarden A Variability in gene expression underlies incomplete penetrance. Nature 2010, 463, 913–918. [DOI] [PMC free article] [PubMed] [Google Scholar]
- (5).Kistler KE; Trcek T; Hurd TR; Chen R; Liang F-X; Sall J; Kato M; Lehmann R Phase transitioned nuclear Oskar promotes cell division of Drosophila primordial germ cells. Elife 2018, 7, e37949. [DOI] [PMC free article] [PubMed] [Google Scholar]
- (6).Rahimi N; Carmon S; Averbukh I; Khajouei F; Sinha S; Schejter ED; Barkai N; Shilo B-Z Global shape of Toll activation is determined by enhancer properties. Proc. Natl. Acad. Sci. U. S. A. 2020, 117, 1552–1558. [DOI] [PMC free article] [PubMed] [Google Scholar]
- (7).Couturier L; Mazouni K; Corson F; Schweisguth F Regulation of Notch output dynamics via specific E(spl)-HLH factors during bristle patterning in Drosophila. Nat Commun 2019, 10, 3486–3486. [DOI] [PMC free article] [PubMed] [Google Scholar]
- (8).York AG; Chandris P; Nogare DD; Head J; Wawrzusin P; Fischer RS; Chitnis A; Shroff H Instant super-resolution imaging in live cells and embryos via analog image processing. Nat. Methods 2013, 10, 1122–1126. [DOI] [PMC free article] [PubMed] [Google Scholar]
- (9).Port F; Chen H-M; Lee T; Bullock SL Optimized CRISPR/Cas tools for efficient germline and somatic genome engineering in Drosophila. Proc. Natl. Acad. Sci. U. S. A. 2014, 111, E2967–E2976. [DOI] [PMC free article] [PubMed] [Google Scholar]
- (10).Ji N; van Oudenaarden A Single molecule fluorescent in situ hybridization (smFISH) of C. elegans worms and embryos WormBook, ed. The C. elegans Research Community, WormBook; 2012, doi/ 10.1895/wormbook.1.153.1, http://www.wormbook.org. [DOI] [PMC free article] [PubMed] [Google Scholar]
- (11).Raj A; van den Bogaard P; Rifkin SA; van Oudenaarden A; Tyagi S Imaging individual mRNA molecules using multiple singly labeled probes. Nat. Methods 2008, 5, 877–879. [DOI] [PMC free article] [PubMed] [Google Scholar]
- (12).Chen KH; Boettiger AN; Moffitt JR; Wang S; Zhuang X Spatially resolved, highly multiplexed RNA profiling in single cells. Science 2015, 348, aaa6090. [DOI] [PMC free article] [PubMed] [Google Scholar]
- (13).Eng C-HL; Lawson M; Zhu Q; Dries R; Koulena N; Takei Y; Yun J; Cronin C; Karp C; Yuan G-C; Cai L Transcriptome-scale super-resolved imaging in tissues by RNA seqFISH+. Nature 2019, 568, 235–239. [DOI] [PMC free article] [PubMed] [Google Scholar]
- (14).Shaffer SM; Wu MT; Levesque MJ; Raj A Turbo FISH: A Method for Rapid Single Molecule RNA FISH. PLoS One 2013, 8, e75120. [DOI] [PMC free article] [PubMed] [Google Scholar]
- (15).Goh JJL; Chou N; Seow WY; Ha N; Cheng CPP; Chang Y-C; Zhao ZW; Chen KH Highly specific multiplexed RNA imaging in tissues with split-FISH. Nat. Methods 2020, 17, 689–693. [DOI] [PubMed] [Google Scholar]
- (16).Rouhanifard SH; Mellis IA; Dunagin M; Bayatpour S; Jiang CL; Dardani I; Symmons O; Emert B; Torre E; Cote A; Sullivan A; Stamatoyannopoulos JA; Raj A ClampFISH detects individual nucleic acid molecules using click chemistry–based amplification. Nat. Biotechnol. 2019, 37, 84–89. [DOI] [PubMed] [Google Scholar]
- (17).Kishi JY; Lapan SW; Beliveau BJ; West ER; Zhu A; Sasaki HM; Saka SK; Wang Y; Cepko CL; Yin P SABER amplifies FISH: enhanced multiplexed imaging of RNA and DNA in cells and tissues. Nat. Methods 2019, 16, 533–544. [DOI] [PMC free article] [PubMed] [Google Scholar]
- (18).Atakan HB; Xiang R; Cornaglia M; Mouchiroud L; Katsyuba E; Auwerx J; Gijs MAM Automated Platform for Long-Term Culture and High-Content Phenotyping of Single C. elegans Worms. Sci. Rep. 2019, 9, 14. [DOI] [PMC free article] [PubMed] [Google Scholar]
- (19).Cornaglia M; Lehnert T; Gijs MAM Microfluidic systems for high-throughput and high-content screening using the nematode Caenorhabditis elegans. Lab Chip 2017, 17, 3736–3759. [DOI] [PubMed] [Google Scholar]
- (20).Cornaglia M; Mouchiroud L; Marette A; Narasimhan S; Lehnert T; Jovaisaite V; Auwerx J; Gijs MAM An automated microfluidic platform for C-elegans embryo arraying, phenotyping, and long-term live imaging. Sci. Rep. 2015, 5. [DOI] [PMC free article] [PubMed] [Google Scholar]
- (21).Dong L; Jankele R; Cornaglia M; Lehnert T; Gonczy P; Gijs MAM Integrated Microfluidic Device for Drug Studies of Early C. Elegans Embryogenesis. Adv. Sci. 2018, 5, 7. [DOI] [PMC free article] [PubMed] [Google Scholar]
- (22).Duffy DC; McDonald JC; Schueller OJ; Whitesides GM Rapid Prototyping of Microfluidic Systems in Poly(dimethylsiloxane). Anal. Chem. 1998, 70, 4974–4984. [DOI] [PubMed] [Google Scholar]
- (23).Stiernagle T Maintenance of C. elegans. WormBook, ed. The C. elegans Research Community, WormBook; 2006, doi/ 10.1895/wormbook.1.101.1, http://www.wormbook.org. [DOI] [PMC free article] [PubMed] [Google Scholar]
- (24).Mueller F; Senecal A; Tantale K; Marie-Nelly H; Ly N; Collin O; Basyuk E; Bertrand E; Darzacq X; Zimmer C FISH-quant: automatic counting of transcripts in 3D FISH images. Nat. Methods 2013, 10, 277–278. [DOI] [PubMed] [Google Scholar]
- (25).Hall DH; Herndon LA; Altun Z Introduction to C. elegans embryo. WormAtlas; 2017. [Google Scholar]
- (26).Goyal Y; Levario TJ; Mattingly HH; Holmes S; Shvartsman SY; Lu H Parallel imaging of Drosophila embryos for quantitative analysis of genetic perturbations of the Ras pathway. Dis. Model. Mech. 2017, 10, 923–929. [DOI] [PMC free article] [PubMed] [Google Scholar]
- (27).Levario TJ; Zhan M; Lim B; Shvartsman SY; Lu H Microfluidic trap array for massively parallel imaging of Drosophila embryos. Nature protocols 2013, 8, 721–736. [DOI] [PubMed] [Google Scholar]
- (28).Jackson-Holmes EL; McDevitt TC; Lu H A microfluidic trap array for longitudinal monitoring and multi-modal phenotypic analysis of individual stem cell aggregates. Lab Chip 2017, 17, 3634–3642. [DOI] [PMC free article] [PubMed] [Google Scholar]
- (29).Chung K; Kim Y; Kanodia JS; Gong E; Shvartsman SY; Lu H A microfluidic array for large-scale ordering and orientation of embryos. Nat. Methods 2011, 8, 171–U103. [DOI] [PMC free article] [PubMed] [Google Scholar]
- (30).Chung K; Rivet CA; Kemp ML; Lu H Imaging Single-Cell Signaling Dynamics with a Deterministic High-Density Single-Cell Trap Array. Anal. Chem. 2011, 83, 7044–7052. [DOI] [PMC free article] [PubMed] [Google Scholar]
- (31).Lee H; Kim SA; Coakley S; Mugno P; Hammarlund M; Hilliard MA; Lu H A multi-channel device for high-density target-selective stimulation and long-term monitoring of cells and subcellular features in C. elegans. Lab Chip 2014, 14, 4513–4522. [DOI] [PMC free article] [PubMed] [Google Scholar]
- (32).Ostromohov N; Huber D; Bercovici M; Kaigala GV Real-Time Monitoring of Fluorescence in Situ Hybridization Kinetics. Anal. Chem. 2018, 90, 11470–11477. [DOI] [PubMed] [Google Scholar]
- (33).Sun G; Wan J; Lu H Rapid and multi-cycle smFISH enabled by microfluidic ion concentration polarization for in-situ profiling of tissue-specific gene expression in whole C. elegans. Biomicrofluidics 2019, 13, 064101. [DOI] [PMC free article] [PubMed] [Google Scholar]
- (34).Folkmann AW; Seydoux G Spatial regulation of the polarity kinase PAR-1 by parallel inhibitory mechanisms. Development 2019, 146, dev171116. [DOI] [PMC free article] [PubMed] [Google Scholar]
- (35).Kemphues KJ; Priess JR; Morton DG; Cheng NS Identification of genes required for cytoplasmic localization in early C. elegans embryos. Cell 1988, 52, 311–320. [DOI] [PubMed] [Google Scholar]
- (36).Boeck ME; Huynh C; Gevirtzman L; Thompson OA; Wang G; Kasper DM; Reinke V; Hillier LW; Waterston RH The time-resolved transcriptome of C. elegans. Genome Res. 2016, 26, 1441–1450. [DOI] [PMC free article] [PubMed] [Google Scholar]
- (37).Packer JS; Zhu Q; Huynh C; Sivaramakrishnan P; Preston E; Dueck H; Stefanik D; Tan K; Trapnell C; Kim J; Waterston RH; Murray JI A lineage-resolved molecular atlas of C. elegans embryogenesis at single-cell resolution. Science 2019, 365, eaax1971. [DOI] [PMC free article] [PubMed] [Google Scholar]
- (38).Guo S; Kemphues KJ par-1, a gene required for establishing polarity in C. elegans embryos, encodes a putative Ser/Thr kinase that is asymmetrically distributed. Cell 1995, 81, 611–620. [DOI] [PubMed] [Google Scholar]
- (39).Suzuki A In Cell Polarity 1: Biological Role and Basic Mechanisms, Ebnet K, Ed.; Springer International Publishing: Cham, 2015, pp 25–50. [Google Scholar]
- (40).Wu Y; Griffin EE Regulation of Cell Polarity by PAR-1/MARK Kinase. Curr. Top. Dev. Biol. 2017, 123, 365–397. [DOI] [PMC free article] [PubMed] [Google Scholar]
- (41).Levin M; Hashimshony T; Wagner F; Yanai I Developmental Milestones Punctuate Gene Expression in the Caenorhabditis Embryo. Dev. Cell 2012, 22, 1101–1108. [DOI] [PubMed] [Google Scholar]
Associated Data
This section collects any data citations, data availability statements, or supplementary materials included in this article.


