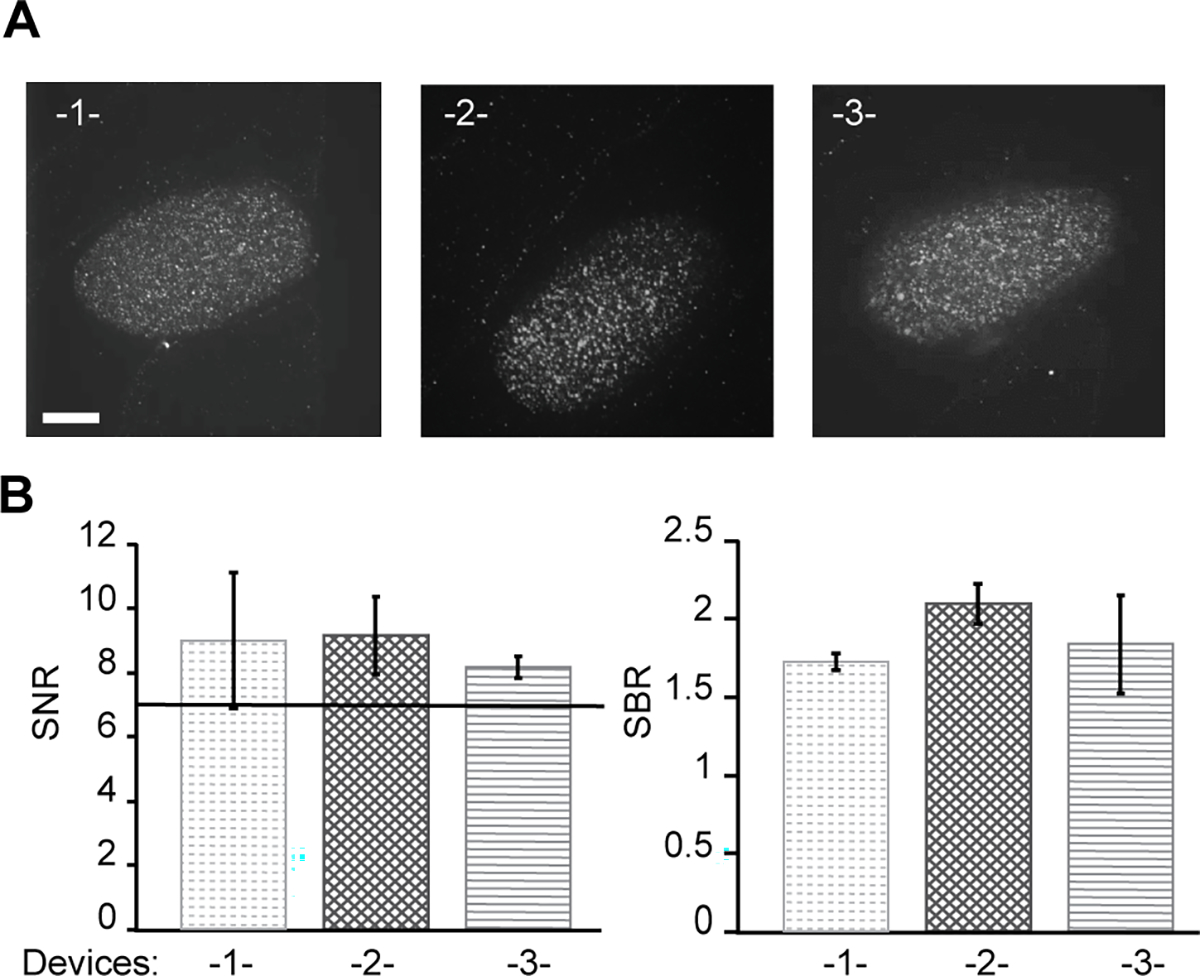
Figure 5.

Integration of multiple arrays on single substrate for high-throughput confocal imaging. (A) Representative smFISH images of embryos from each device. Red puncta indicate individual par-1 molecules. Scale bar is 15 μm. (B) Quantification of image quality using SNR and SBR of puncta in each separate device. Error bars represent SD, n = 20 embryos.
