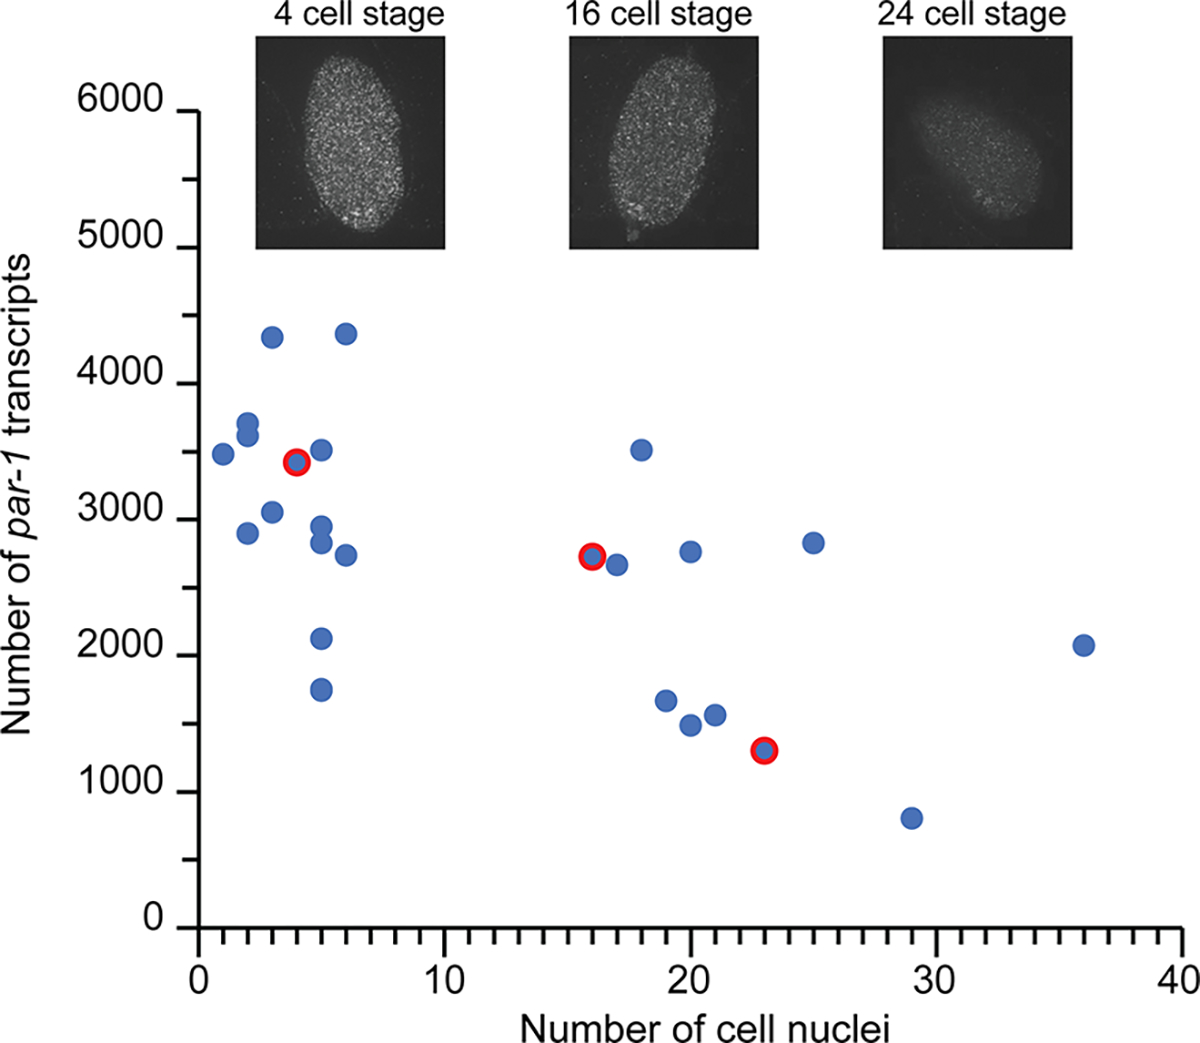
Figure 6.

Time-resolved analysis of par-1 gene expression changes during early embryogenesis showing the transcript count versus number of cell nuclei (n = 25 embryos). Inserts show representative smFISH images of embryos at different developmental stages corresponding to the red-circled data points.
