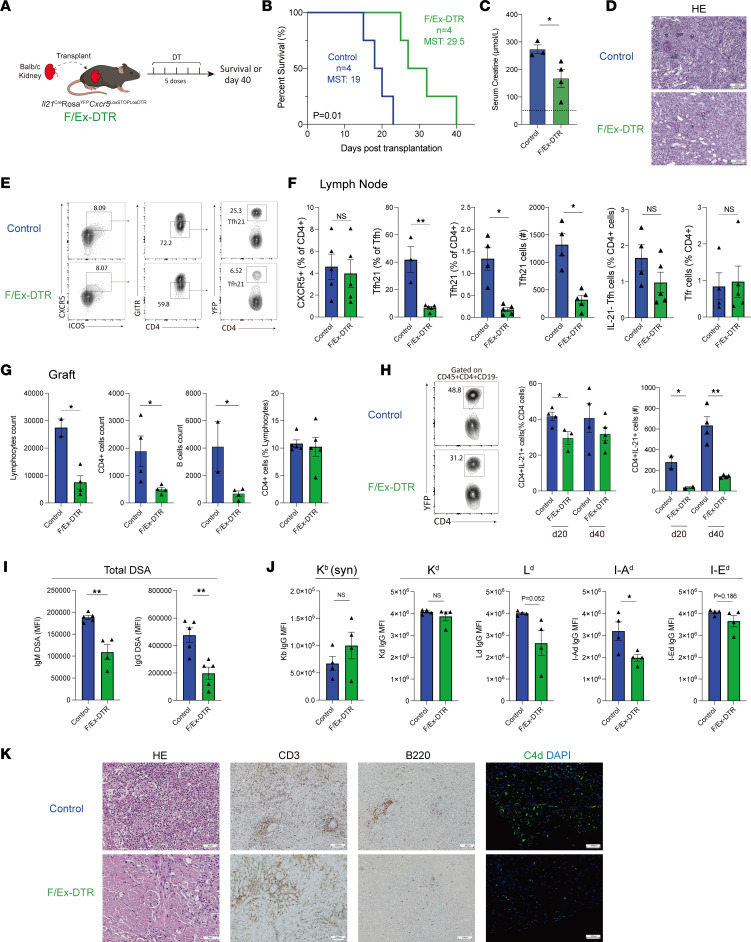
Figure 5. IL-21–producing Tfh cells are required for Ab-mediated rejection after kidney transplantation.
(A) Schematic of IL-21–producing Tfh cell deletion using F/Ex-DTR mice. Control (Il21CreRosa26Lox-STOP-Lox-YFPCxcr5WT) or F/Ex-DTR (Il21CreRosa26Lox-STOP-Lox-YFPCxcr5Lox-STOP-Lox-DTR) mice were transplanted with a Balb/c kidney and cells deleted with the administration of DT. Life-sustaining, in B–D,or non–life-sustaining, in E–K, transplants were performed. (B) Survival of transplanted recipients between the control and the F/Ex-DTR group. MST, median survival time. (C) Serum creatinine levels of recipient mice. (D) Representative histological images of transplanted kidneys at the time of graft rejection. Scale bars: 100 μm; original magnification: ×100. (E) Gating strategy for IL-21–producing Tfh cells (gated as CD4+CD19–CXCR5+ICOS+GITR–YFP+) in the dLNs. (F) Quantification of CXCR5+ cells in total CD4+ T cells, IL-21–producing Tfh (Tfh21) and cell number, IL-21–nonproducing (IL-21–) Tfh cells, and Tfr (CD4+CD19–CXCR5+ICOS+GITR+) cells in dLNs. (G) Quantification of infiltrating lymphocytes, CD4+ T cells, and CD19+ B cells, as well as the frequency of CD4+ T cells, in transplanted grafts. (H) Quantification of IL-21–producing CD4+ T cells in kidney grafts at day 20 or 40 after transplantation. Left: frequency; and right: cell number. (I) Total IgG DSAs from serum of mice 40 days after transplantation. (J) Single antigen assays to assess IgG allospecificity. Syn, syngeneic. (K) Representative histological images of transplanted kidneys at postoperative day 40, including H&E, IHC staining for CD3 and B220, and IF staining for C4d. Scale bars: 100 μm; original magnification: ×100. Data are combined from 2 independent experiments with n = 3–5 mice per group. Kaplan-Meier survival analysis and a log-rank test for survival analysis for B and Student’s 2-tailed unpaired t test for 2-group comparisons for C and F–J. *P < 0.05; **P < 0.01.

