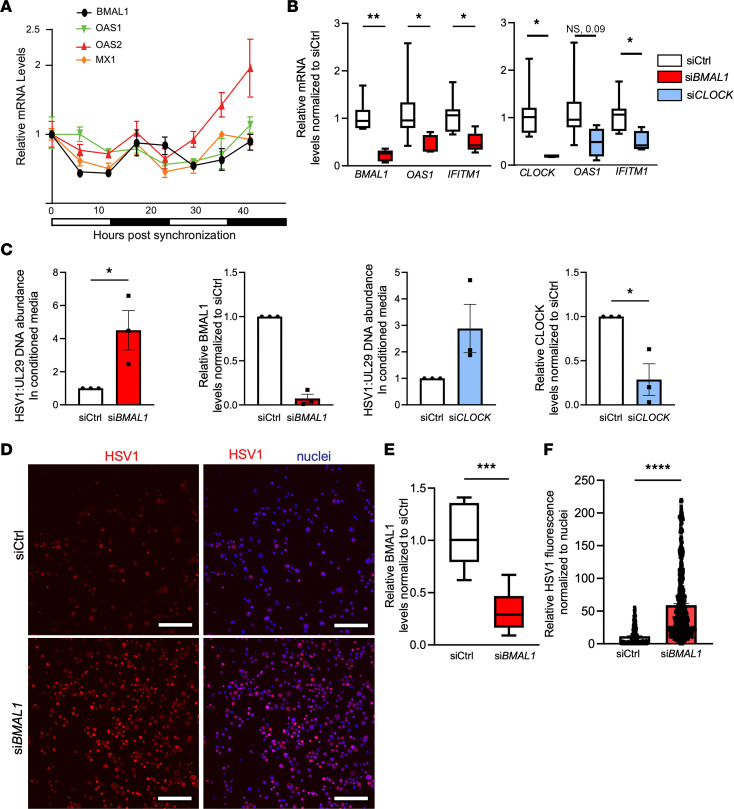
Figure 4. Keratinocyte autonomous circadian rhythm regulates antiviral activity.
(A) qRT-PCR of BMAL1, OAS1, OAS2, and MX1 in human primary keratinocytes synchronized via growth factor starvation and harvested every 6 hours (representative of 3 independent experiments). Graphs represent relative mRNA ± SEM with GAPDH used for an internal control and relative to that of 0-hour time point. (B) qRT-PCR of BMAL1, CLOCK, OAS1, and IFITM1 in NTERT keratinocytes transfected with siRNA: siCtrl, siCLOCK, or siBMAL1 (n = 3 biological replicates). Graphs represent averages of relative mRNA ± SEM with GAPDH used for an internal control. (C) qPCR of HSV-1 gene UL29 in cell culture–conditioned medium of primary keratinocytes transfected with siCtrl, siBMAL1, or siCLOCK 24 hours prior to infection with HSV-1 (MOI, 0.01). Knockdown efficacy is shown by qRT-PCR. Graphs represent averages of either relative DNA or mRNA ± SEM with GAPDH used for an internal control. Primary keratinocytes from donors were pooled (n = 3). (D) Immunofluorescence of HSV-1 (MOI, 0.01) in human NTERT keratinocytes transfected with siCtrl or siBMAL1. Scale bar: 160 μm. (E and F) Knockdown efficacy of BMAL1 in human NTERT cells is shown by qRT-PCR. ImageJ (Fiji) quantification of relative viral immunofluorescence normalized to nuclear staining. Box-and-whisker plots represent averages of relative immunofluorescence ± SEM (n = 3 samples/group in E; n > 400 cells/condition in F). P values reported in this figure were obtained via 2-tailed Student’s t test. *P ≤ 0.05, **P ≤ 0.01, ***P ≤ 0.001, ****P ≤ 0.0001.

