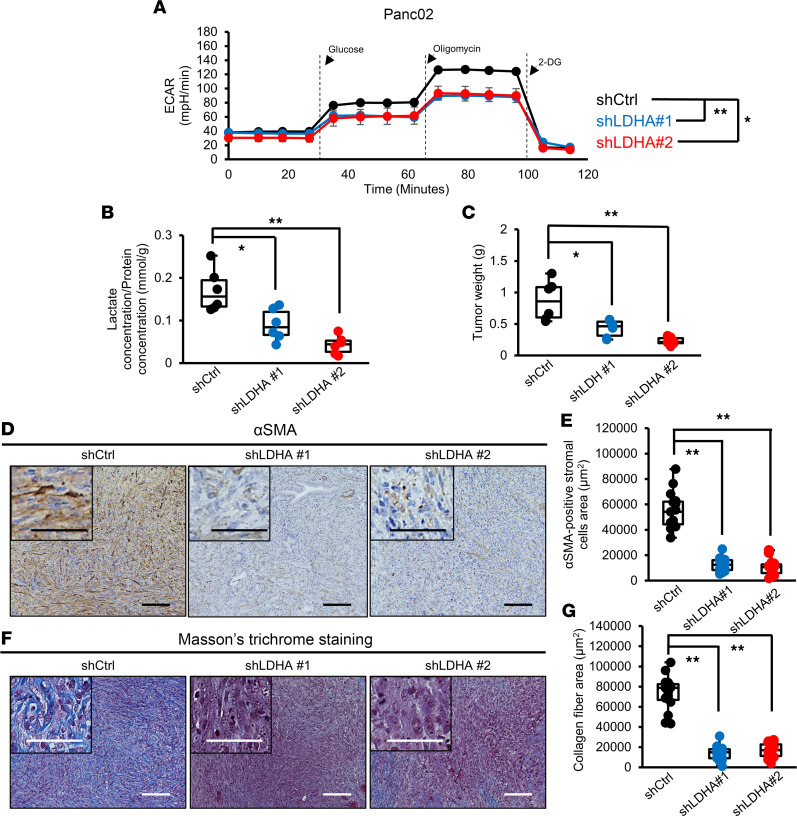
Figure 2. CAF numbers in the PDAC TME are reduced by LDHA KD in tumor cells.
(A) Analysis of the glycolytic ability of Panc02 cells using a flux analyzer after knockdown of LDHA (n = 3). (B) Measurement of the lactate concentration in tumors from the Ctrl and LDHA-KD groups (n = 6). (C) Weight of tumors from the Ctrl and LDHA-KD groups (n = 6). (D) Representative images of αSMA immunohistochemical staining in resected tumors from the Ctrl and LDHA-KD groups. (E) Quantification of the αSMA-positive stromal area in Ctrl and LDHA-KD tumors (n = 15). (F) Representative images of Masson’s trichrome staining in tumors from the Ctrl and LDHA-KD groups. (G) Quantification of the blue-stained collagen fibers in the stromal area in Ctrl and LDHA-KD tumors (n = 15). Scale bars: 100 μm. Box plots show the interquartile range (box), median (line), and minimum and maximum (whiskers). *P < 0.05; **P < 0.01. A Student’s t test was used to compare continuous variables between 2 groups. One-way ANOVA followed by Tukey’s multiple-comparison test was used to compare multiple groups.

