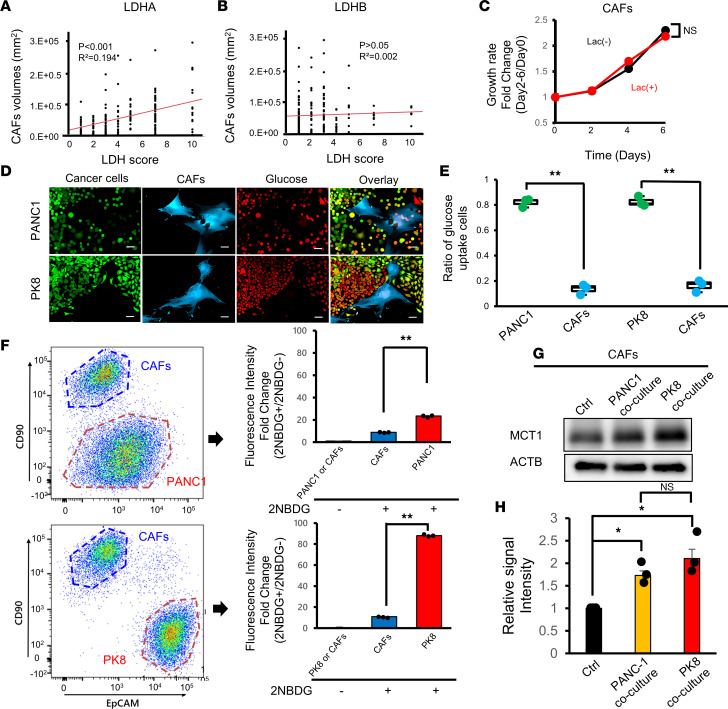
Figure 3. Metabolic competition between PDAC tumor cells and CAFs.
(A and B) Correlations between the number of CAFs and the expression of LDHA (A) or LDHB (B) in PDAC patients (n = 190). (C) Growth assay performed with human CAFs stimulated with lactate in complete medium (n = 3). (D) Representative fluorescence microscopy images of PANC-1 (top) or PK8 (bottom) cells cultured with human CAFs and fluorescently labeled glucose. Scale bars: 50 μm. (E) Quantification of glucose uptake by PDAC cells or CAFs counted under a fluorescence microscope (n = 3). (F) Quantification of glucose uptake by PDAC cells or CAFs by flow cytometry. (G) Western blotting analysis of MCT1 expression in CAFs cocultured with PANC-1 or PK8 cells. (H) Quantification of the intensity of MCT1 in Western blot analysis in G (n = 3). *P < 0.05; **P < 0.01. A Student’s t test was used to compare continuous variables between 2 groups. One-way ANOVA followed by Tukey’s multiple-comparison test was used to compare multiple groups. 2NBDG, 2-[N-(7-nitrobenz-2-oxa-1,3-diazol-4-yl)amino]-2-deoxy-d-glucose.

