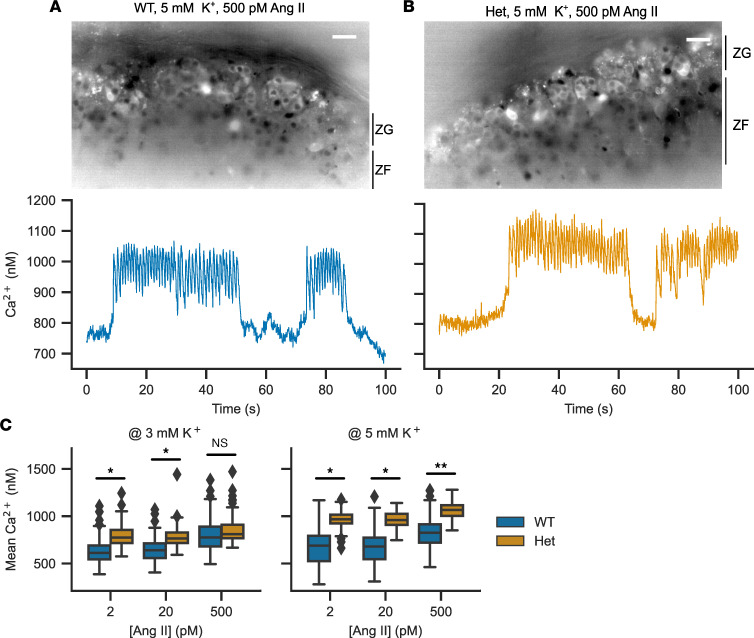
Figure 5. Calcium imaging in acute adrenal slices to determine the response of the zona glomerulosa to potassium and angiotensin II.
(A and B) Representative image of a WT (A) or Ile772Met/+ (B) adrenal slice stained with Fura-2 AM (top). On the bottom, representative traces are shown. Scale bars: 10 μm. (C) Mean calcium concentrations in zona glomerulosa cells determined by imaging of Fura-2 AM–stained slices. The extracellular concentration of angiotensin II was varied between 2 and 500 pM in the presence of either 3 (left) or 5 mM K+ (right) (likelihood ratio test of linear mixed models; exact statistical values are given in Table 2; *P <0.05, **P < 0.01).

