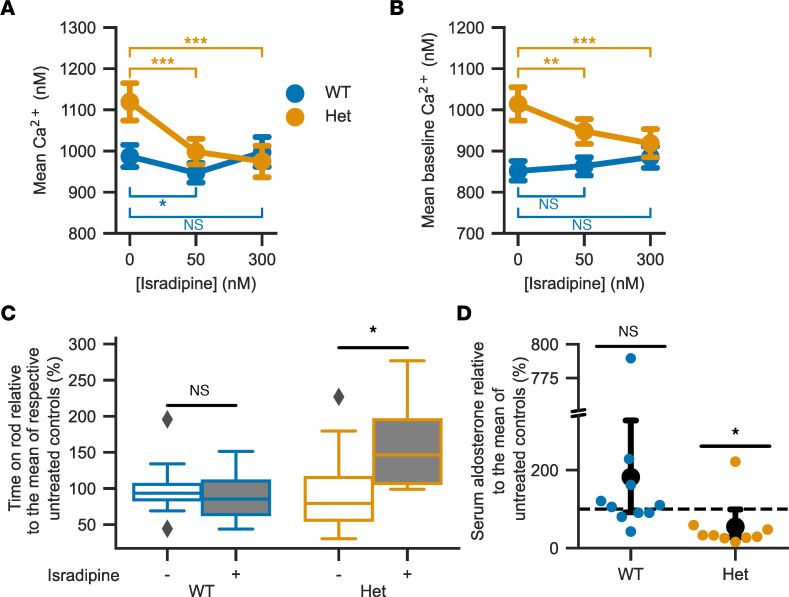
Figure 9. Treatment with the L-type calcium channel blocker isradipine partially reverses the effects of the Ile772Met mutation.
(A) Isradipine lowers mean intracellular calcium concentrations (likelihood ratio test of linear mixed models; 50 nM versus 0 nM isradipine: nWT, cells = 143, nWT, slices = 12, Padj = 0.028, χ2 = 6.08, df = 1; nHet, cells = 85, nHet, slices = 9, Padj = 2.16 × 10⁻⁷, χ2(1) = 28.36; 300 nM versus 0 nM isradipine: nWT, cells = 143, nWT, slices = 12, Padj = 1.0, χ2(1) = 0.22; nHet, cells = 85, nHet, slices = 9, Padj = 2.56 × 10⁻⁷, χ2(1) = 27.89; 4 mM K+ and 100 pM Ang II). (B) Isradipine lowers baseline intracellular calcium concentrations in Het mice (cells/slices from A; mean ± 95% CI; likelihood ratio test of linear mixed models; 50 nM isradipine: WT: Padj = 0.8, χ2(1) = 0.72; Het:, Padj = 0.0016, χ2(1) = 11.15; 300 nM isradipine: WT: Padj = 0.11, χ2(1) = 3.72; Het: Padj = 4.48×10⁻⁸, χ2(1) = 32.82). P values in A and B were adjusted for multiple comparisons using the Bonferroni procedure. (C) Four hours after the last isradipine dose, treated (+) Het show a significant improvement in rotarod performance compared with untreated controls (–) (2-tailed t test; nWT, treated = 10, nWT, control = 11, Pwt = 0.63, twt = -0.50; nHet, treated = 9, nHet, control =9, PHet = 0.03, tHet = 2.17). Values were normalized to the mean of untreated mice of the same genotype. (D) In Het mice, serum aldosterone is lower relative to controls (95% CI, 92.1–327.1, Het: 27.7–99.0; mean ± 95% CI, black circles ± whiskers; 100% of controls is indicated with dashed line, and individual values are shown as colored circles). The break in the y axis extends from 340 to 750%. See Supplemental Figure 8A for absolute values.

