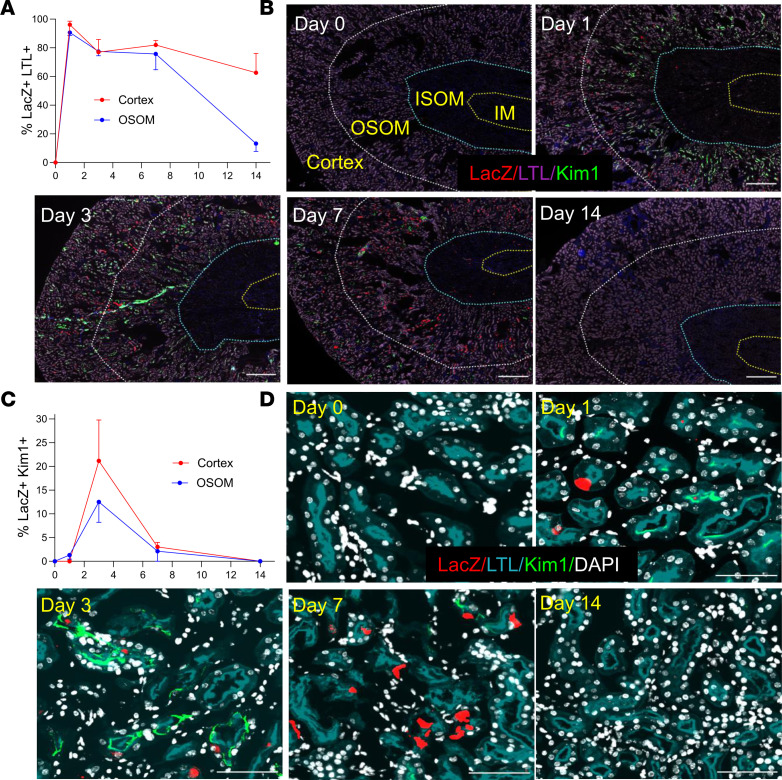
Figure 3. RAR signaling is extensively activated in Kim1– PTECs after Rhabdo-AKI.
RARE-LacZ reporter mice were used to evaluate the cellular localization of RAR signaling after Rhabdo-AKI. (A and C) Percentage of LacZ+ cells in LTL+ and Kim1– PTECs (A) and in Kim1+ PTECs (C) at the different time points after injury in the cortex and OSOM: 2 mice before injury (day 0) and 4 at days 1 and 3, 3 at day 7, and 5 at day 14 after injury. (B and D) Images showing LacZ, LTL, and Kim1 staining in the cortex and OSOM. (B) Low-power images of the kidneys; regions of the kidney are demarcated by dotted lines, as indicated. Scale bars: 500 mM. (D) High-power images of the OSOM. Scale bars: 100 mM.

