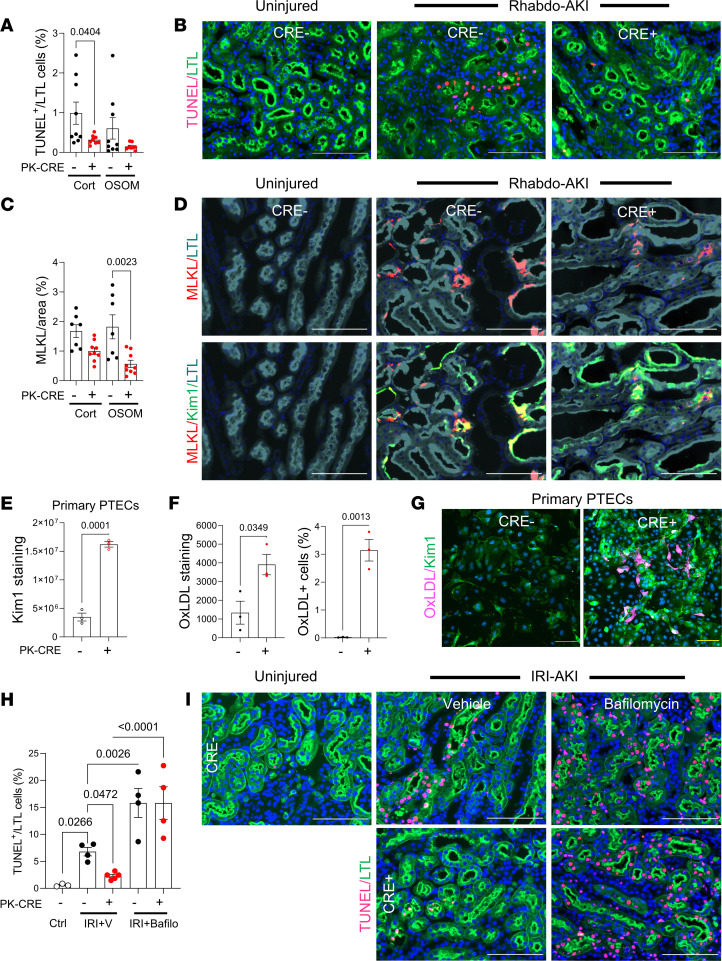
Figure 8. Increased efferocytosis in PTEC DN RAR mice after AKI.
(A–E) Apoptosis in PTEC DN RAR mice 3 days after Rhabdo-AKI. (A) The percentage of TUNEL+LTL+ cells in the cortex and OSOM. (B) TUNEL and LTL staining in the OSOM. (C) Percentage of MLKL staining. (D) MLKL with LTL and Kim1 staining in the OSOM. (E–G) Kim1 expression and endocytic activity in cultured PTECs. (E) Kim1 fluorescence intensity. (F) PTECs uptake of fluorescently conjugated oxidized LDL (Ox-LDL). Fluorescence intensity and numbers of PTECs taking up Ox-LDL. (G) Kim1 staining and Ox-LDL uptake. (H and I) Lysosomal clearance of apoptotic cells in PTEC DN RAR mice. (H) PTEC DN RAR mice after bilateral IRI-AKI pretreated with bafilomycin A1. Kidneys harvested at 24 hours. The percentage of TUNEL+LTL+ cells in the OSOM. (I) TUNEL and LTL staining. Scale bars: 100 mM (B, D, E, and J), 20 mM (H). A, C, E, and F used t tests, with P values comparing PEPCK Cre+ and Cre– mice. H used 1-way ANOVA, with P < 0.05 considered significant; q values are shown for between-group comparisons corrected for repeated testing.

