Figure 5.
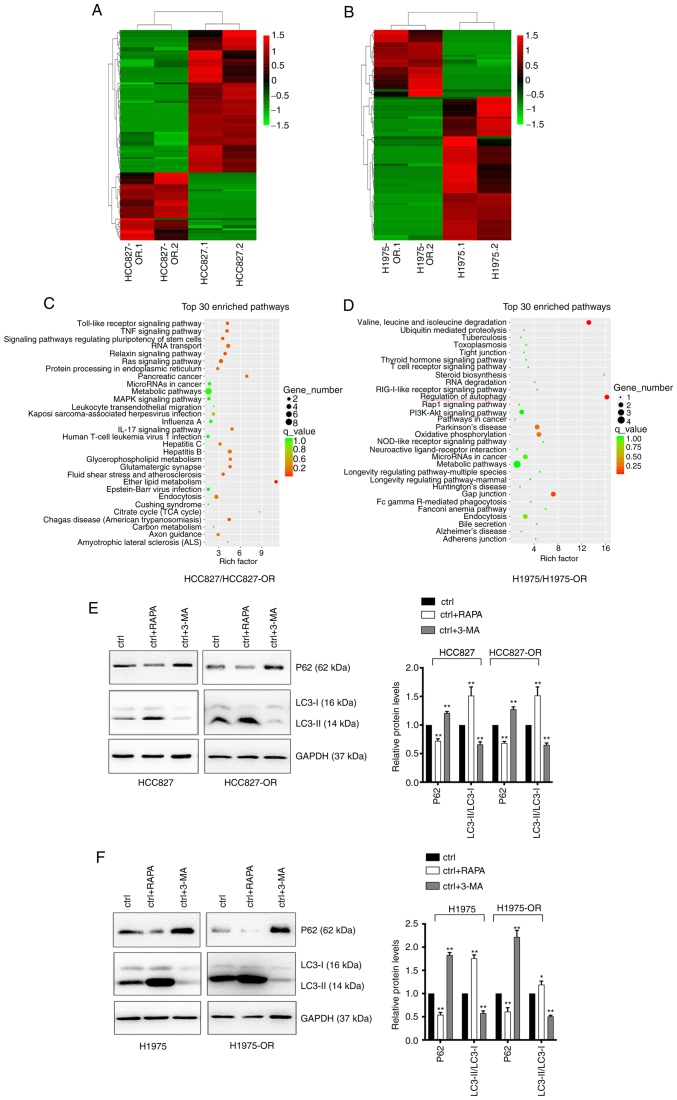
Profiles of differentially expressed circRNAs in HCC827, HCC827-OR, H1975 and H1975-OR cells. Unsupervised hierarchical clustering analysis of the differentially expressed circRNAs between (A) HCC827 and HCC827-OR cells, and (B) H1975 and H1975-OR cells. Kyoto Encyclopedia of Genes and Genomes analysis for the host genes of differentially expressed circRNAs in (C) HCC827 and HCC827-OR cells, and (D) H1975 and H1975-OR cells. Rich factor represents the enrichment degree of differentially expressed genes. The y-axis shows the name of the enriched pathways. The area of each node represents the number of enriched host genes of differentially expressed circRNAs. The P-value is represented by a color scale. (E) HCC827 and HCC827-OR cells, and (F) H1975 and H1975-OR cells were treated with 10 µM RAPA or 1 nM 3-MA for 24 h at 37°C, and the expression levels of autophagy-related proteins were detected by western blot analysis. Western blots were semi-quantified. *P<0.05 and **P<0.01 vs. ctrl. 3-MA, 3-methyladenine; circRNA, circular RNA; ctrl, control; RAPA, rapamycin.

