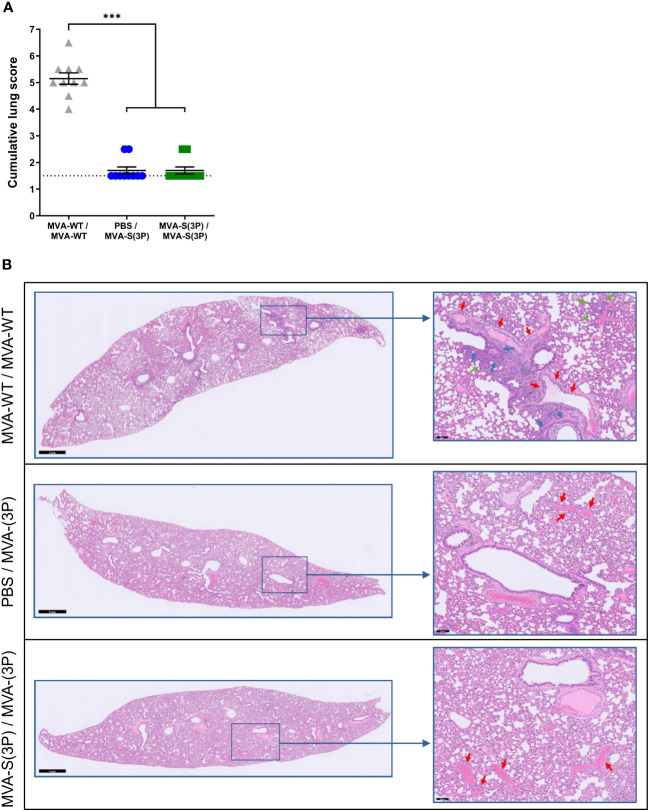
Figure 3.
Lung histopathology. (A) Histopathologic scoring of hematoxylin and eosin-stained sections of hamster lungs on day 4 post-SARS-CoV-2 infection. Data presented as means ± SEM. The dotted line represents the mean lung score of uninfected hamsters (1.5). Statistical significance between groups was calculated using an unpaired non-parametric Kruskal-Wallis test (***p<0.0002). (B) Representative hematoxylin and eosin-stained images of lung sections from MVA-WT- and MVA-S(3P)-vaccinated hamsters on day 4 after SARS-CoV-2 infection. The general view of the lung (left) has been shown along with histopathological details of selected lung areas (blue boxes) (right). Green, red, and blue arrows (right panel) indicate bronchopneumonia, peri-vascular inflammation with endothelialitis, and peri-bronchial inflammation, respectively. Scale bars: 1 mm (left) and 100 μm (right).

