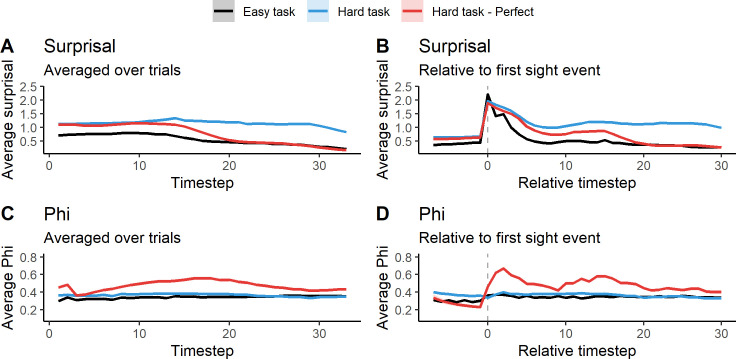
Fig 4. Average Φ and surprisal over trial time for the easy task (black), the hard task (blue) and perfect animats in the hard task (red).
A) average surprisal over trial time. B) average surprisal over trial time, centered around the first observation of the block. C) average Φ over trial time. D) average Φ over trial time, centered around the first observation of the block. Shading around lines is the standard error of the mean. See S5 Fig for the variability across LODs. Note that the averages on B and D are based on a decreasing number of trials as the relative timestep gets further away from 0. In order for the relative timestep to go to 30, at a given trial, the animat needs to see the block within the first few real timesteps.

