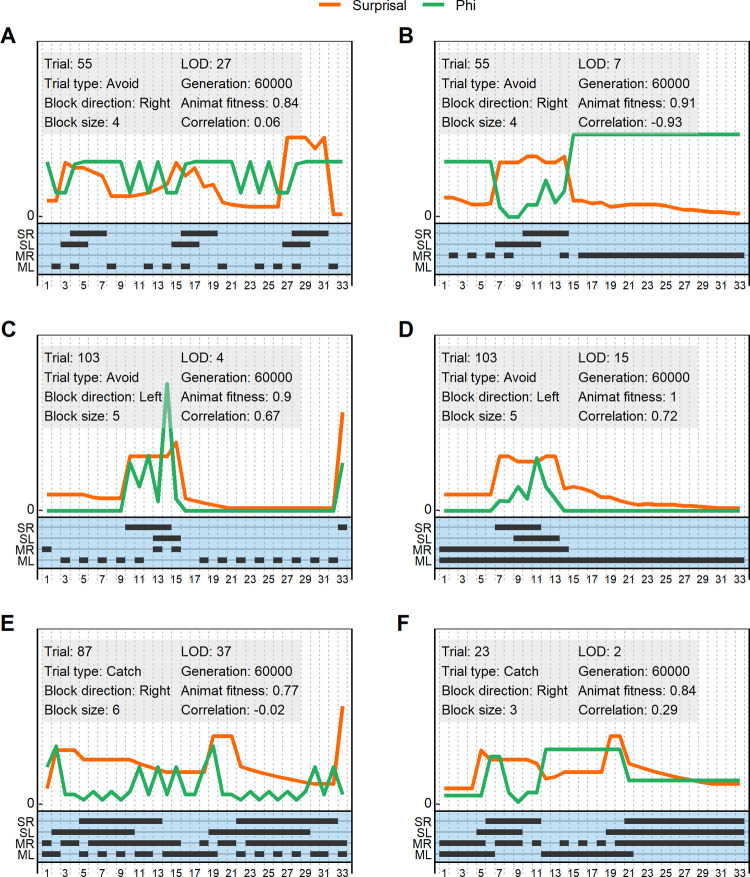
Fig 5.
A-F) Within-trial representation of example animat behavior, Φ and surprisal. The gray box of each plot shows information about the trial and the animat, and the correlation between Φ and surprisal. The x-axis shows timesteps within the trial. The orange line denotes surprisal, and the green line denotes Φ. Each is plotted on an arbitrary y-axis for better comparison where only the zero point is indicated. The lower half of each plot shows the right and left sensory states (SR, SL) and motor states (MR, ML), with black lines indicating activation. Sensory states are active when the block is perceived. Motor states are activated by the animat, and makes it move in the given direction; if both motor states are active the animat stands still. Plots are chosen to show a variety of patterns of behavior, Φ and surprisal. All examples are taken from animats in the hard task.

