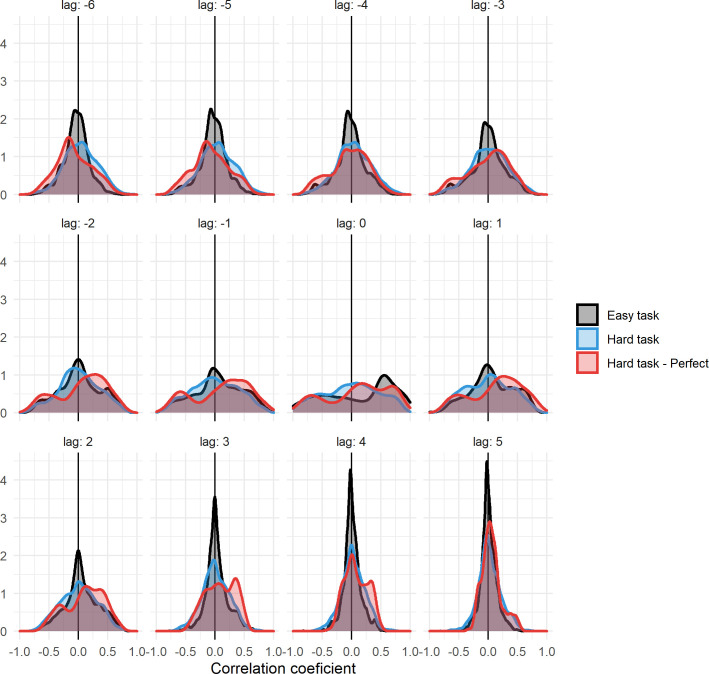
Fig 6. The distribution of correlation strengths between Φ and surprisal, across all trials on the last generation of all LODs.
Shown for time lags around 0, denoted above each of the graphs. Correlations are shown for all animats in the easy task (black), for all animats in the hard task (blue) and for only perfect animats in the hard task (red). The lagging variable was Φ, meaning that for negative lags the correlations measure the relationship between Φ and future surprisal, and vice versa for positive lags. Note that trials where Φ = 0 throughout are excluded from this analysis.

